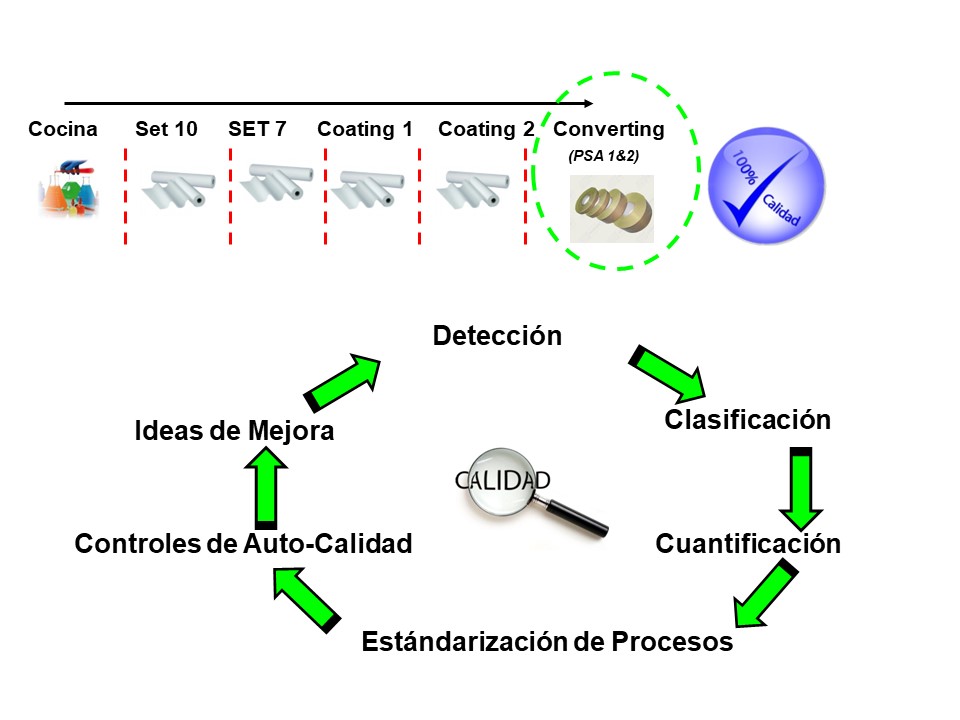
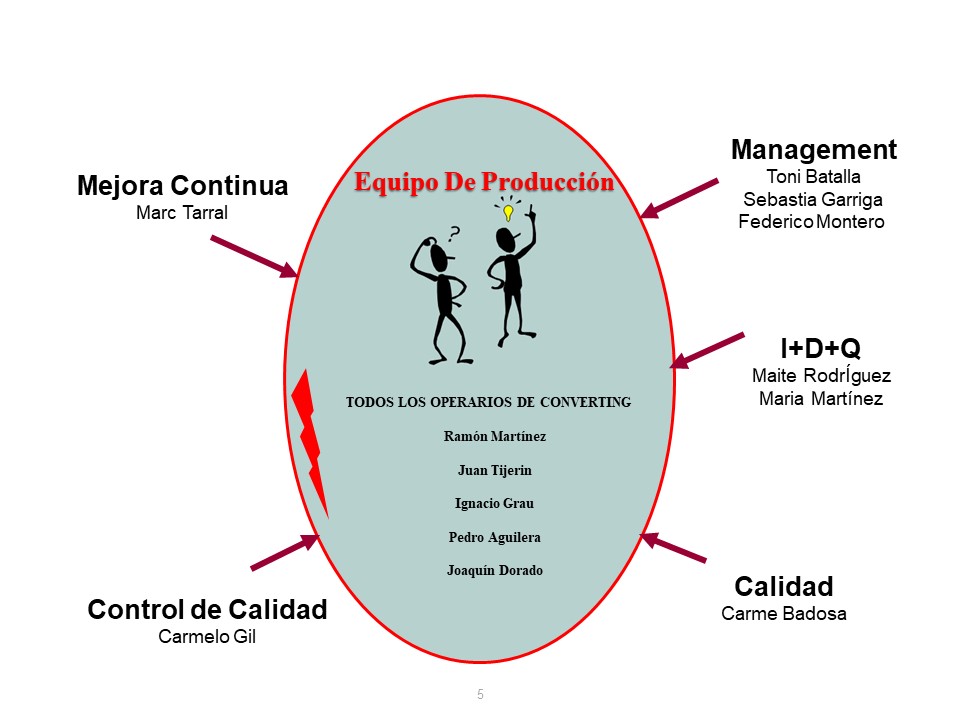
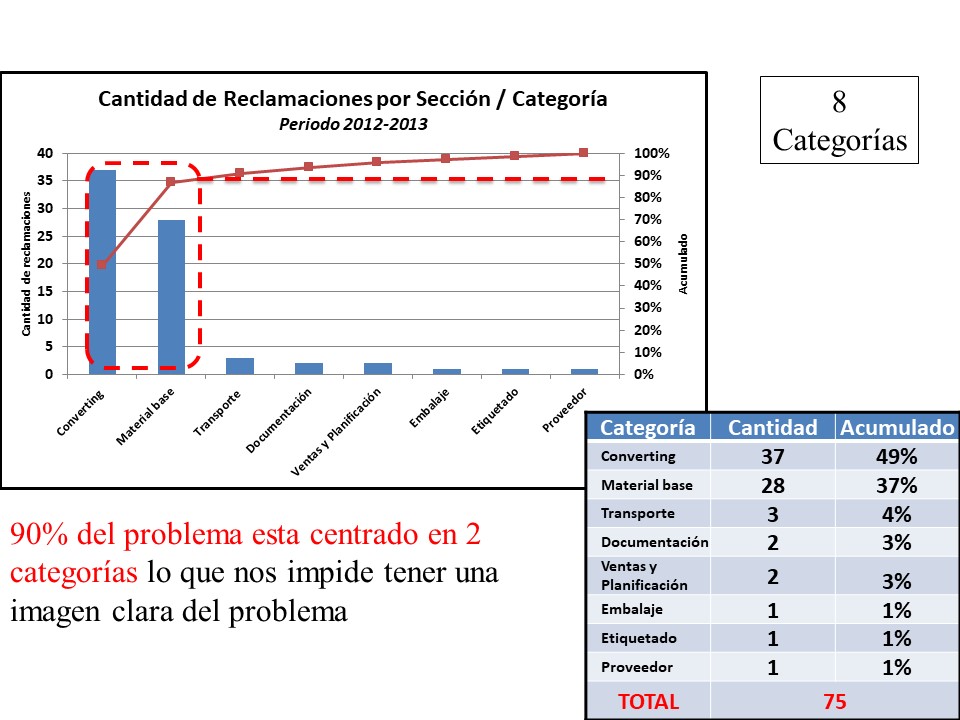
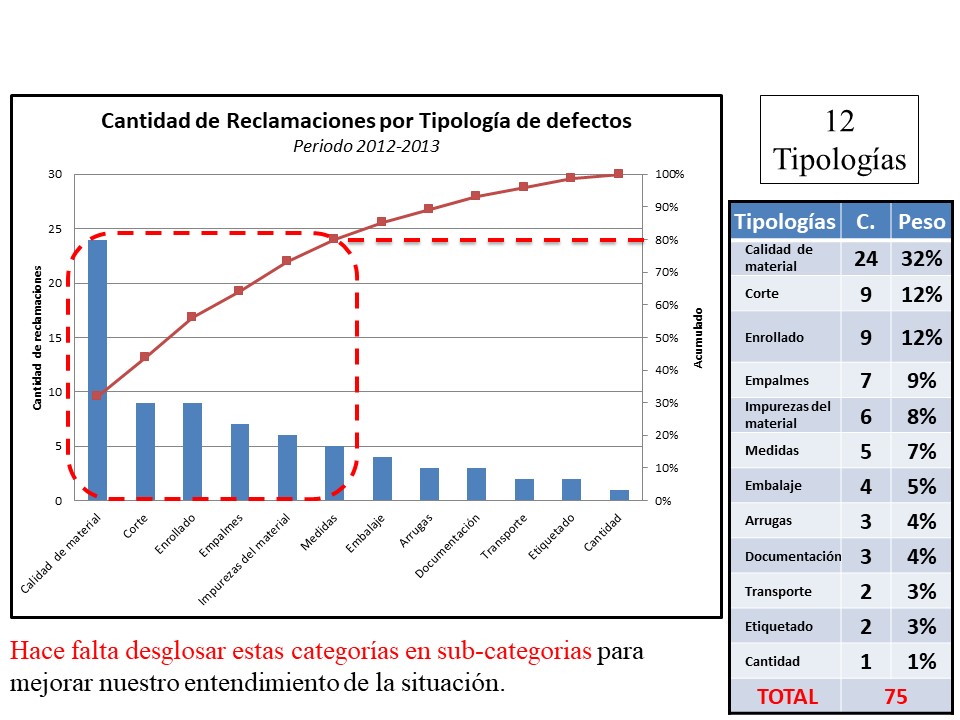
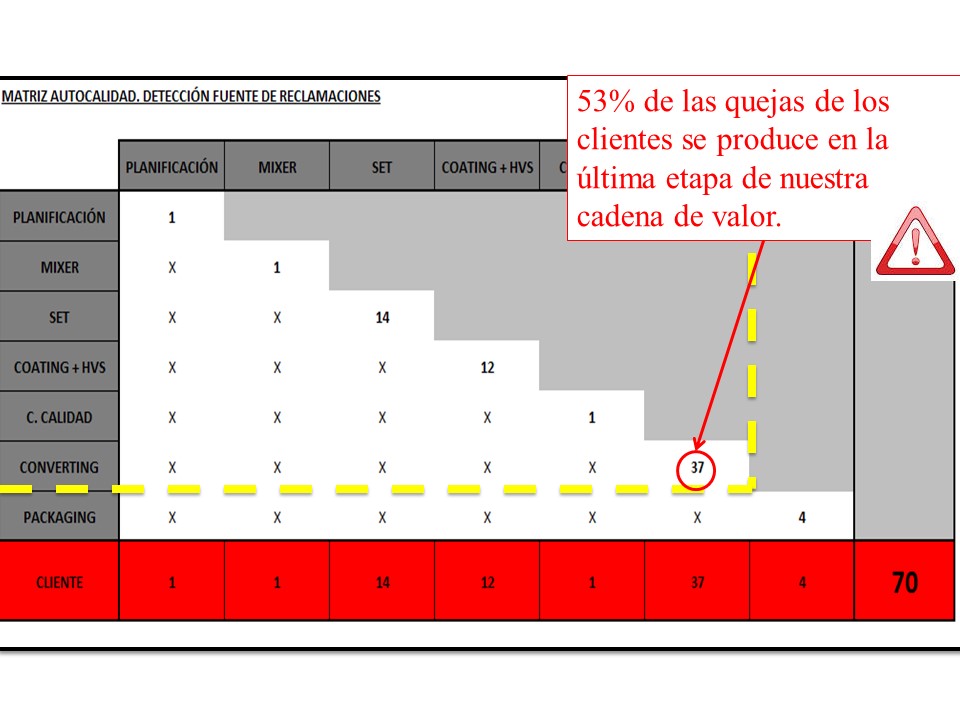
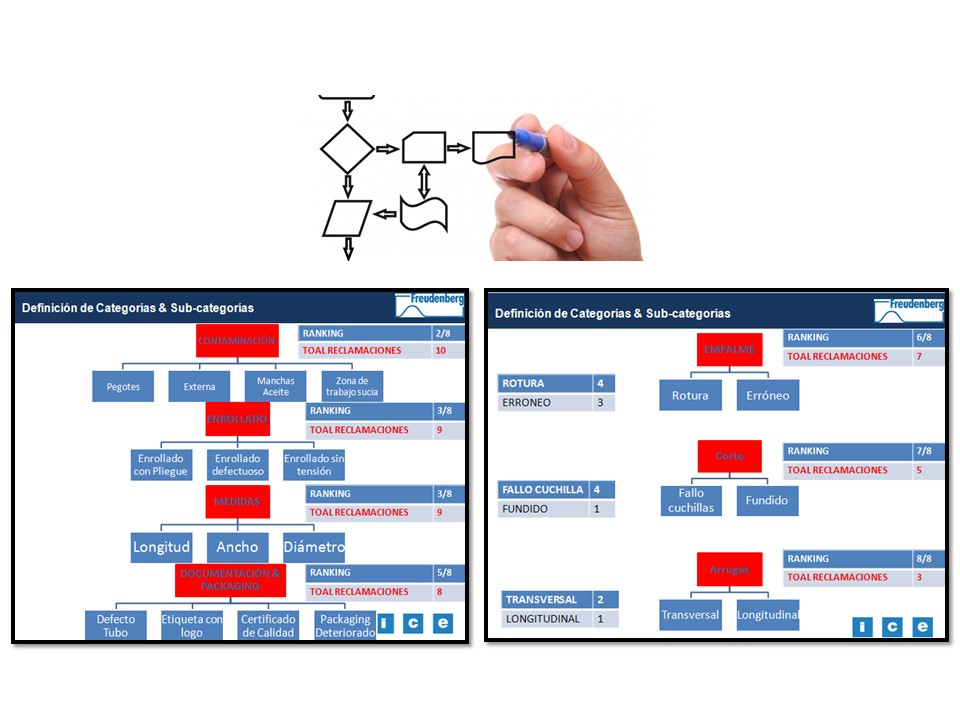
Starting point
- High amount of NCI/NCE
- NCE/NCI information on paper
- Complexity of controlling the cost of non-quality
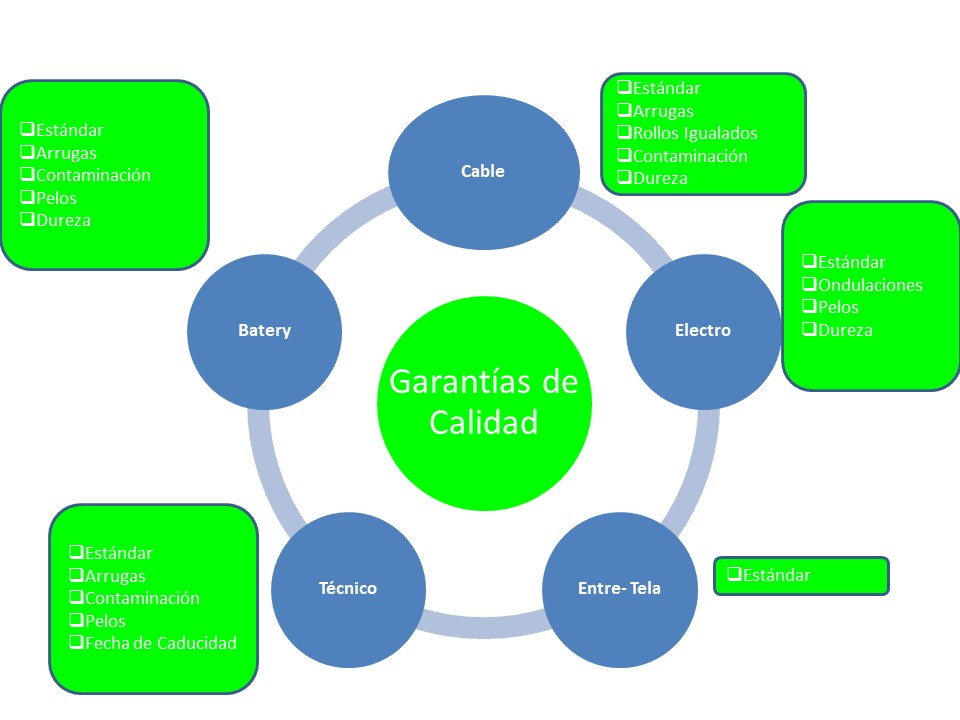
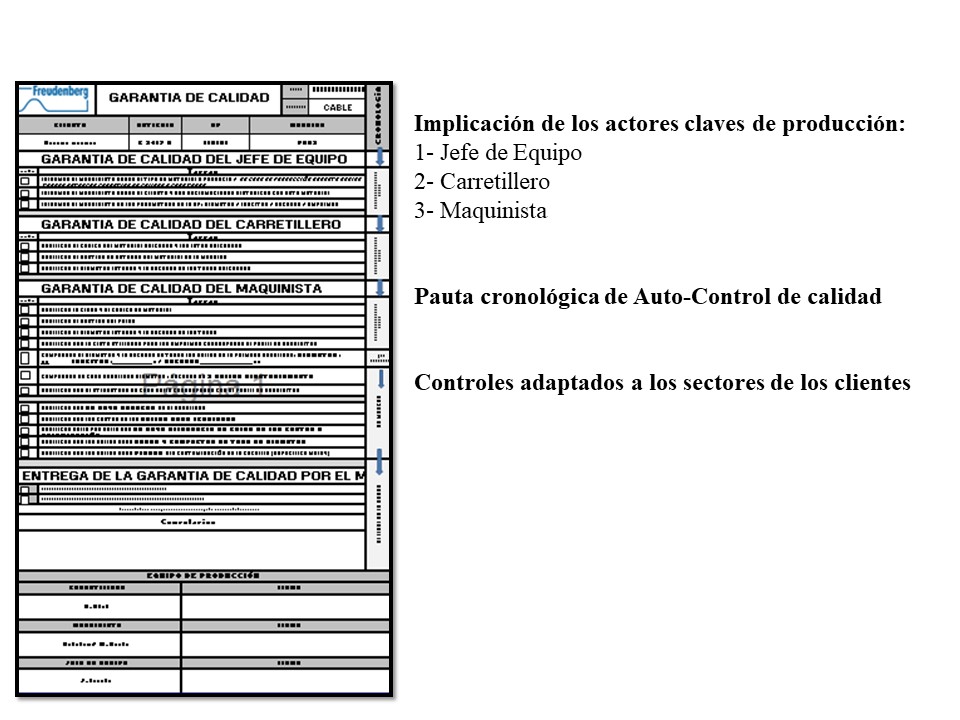
- Absence of Quality “Doors”
- Increased waste and therefore costs
- Lack of quality KPIs
- Impossible to make the right decisions
- Integration of business processes
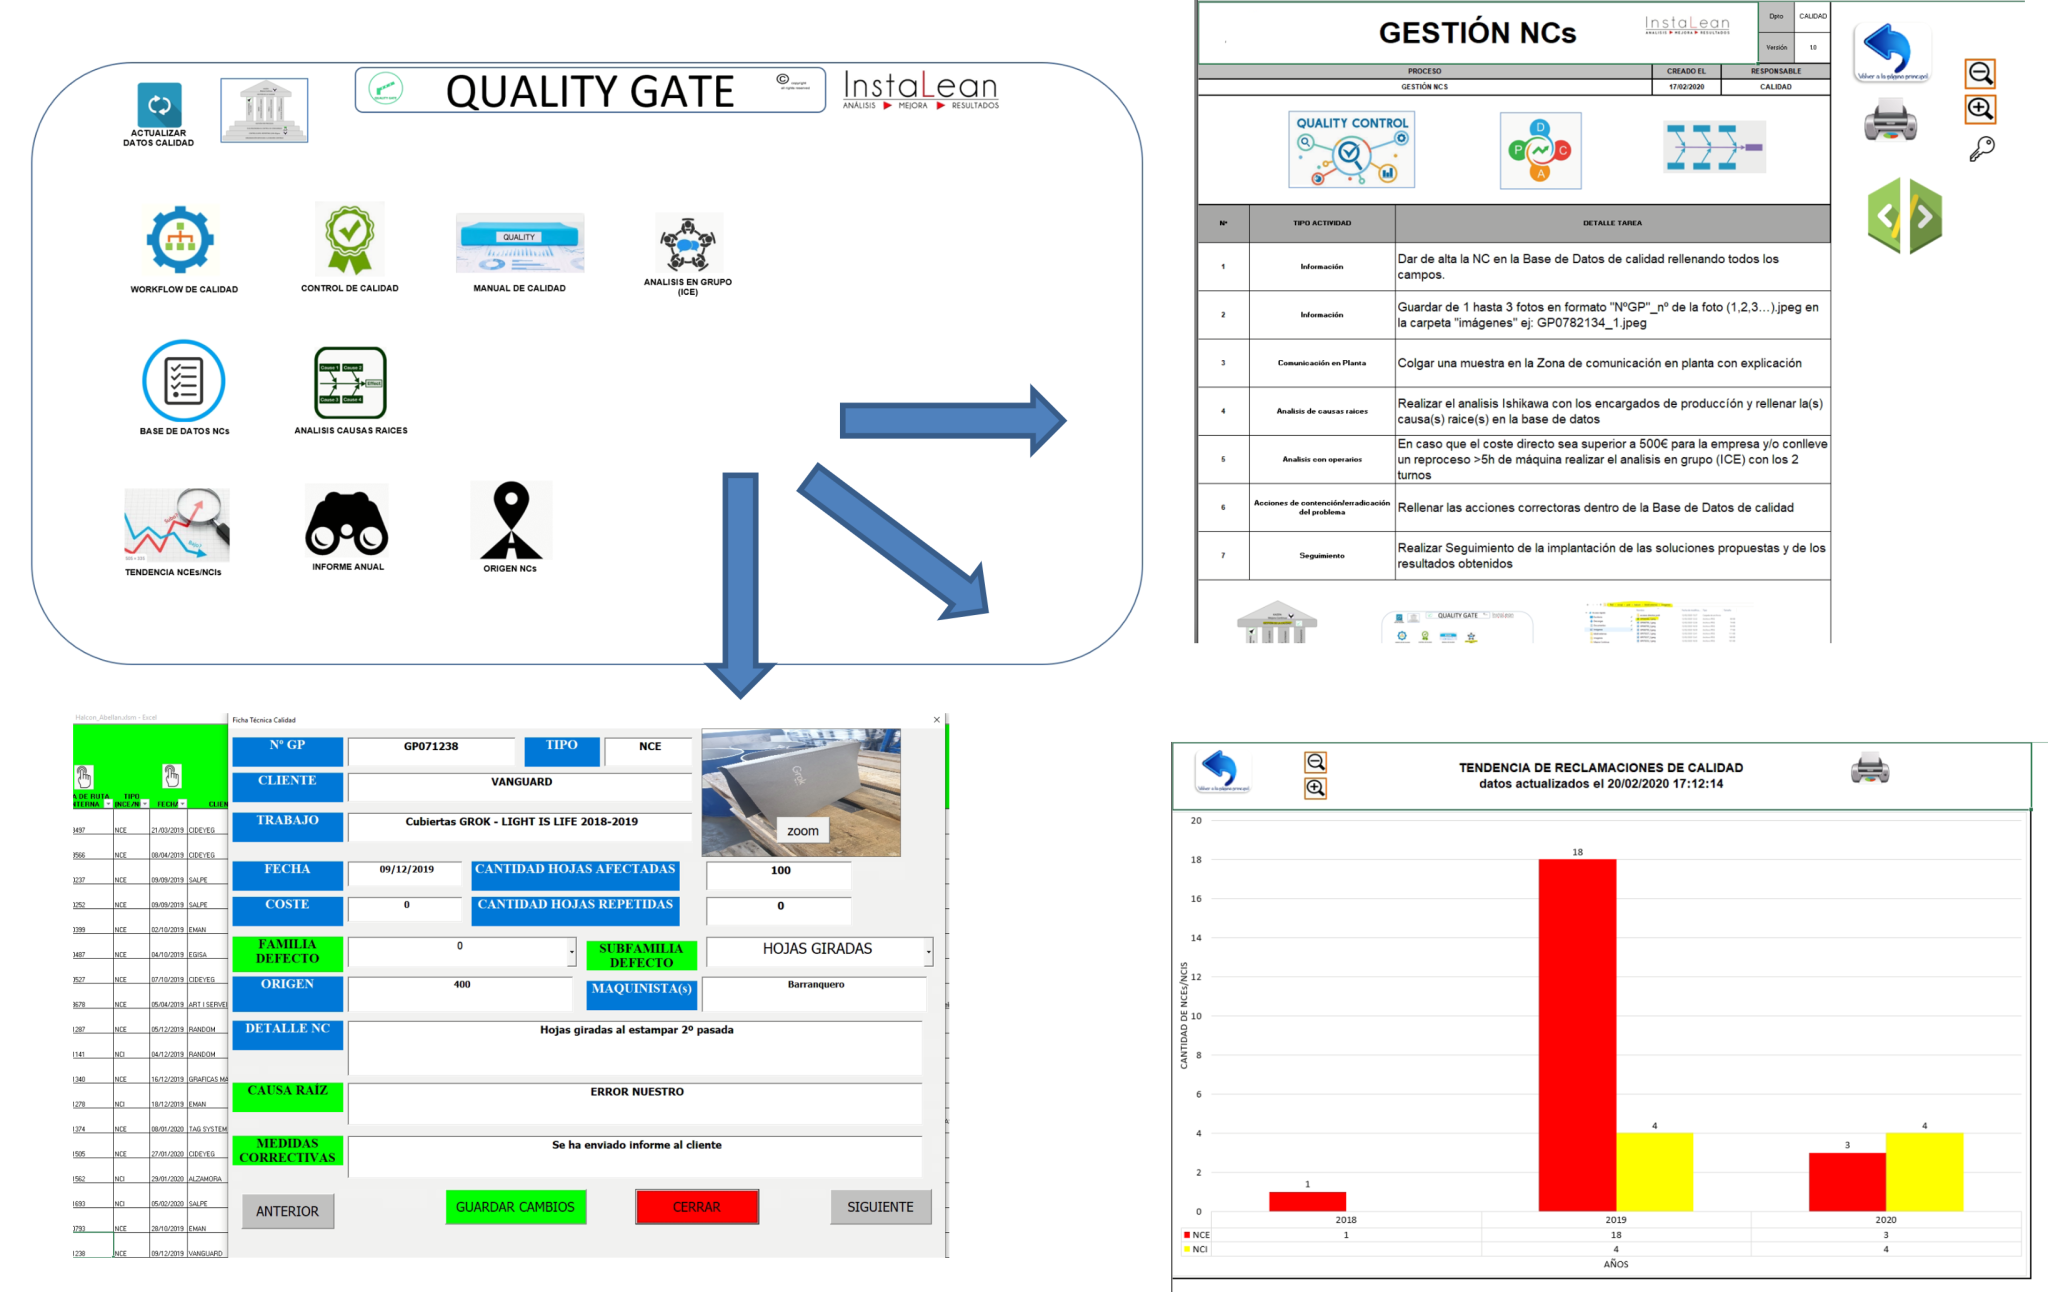
- NCE/NCI Management Flow
- Total control of quality KPIs
- Smart Reporting of Losses
- Cost reduction of poor quality
- Introduction to Quality Checklist
Total Quality: Staff formation
Summary of Training Activities
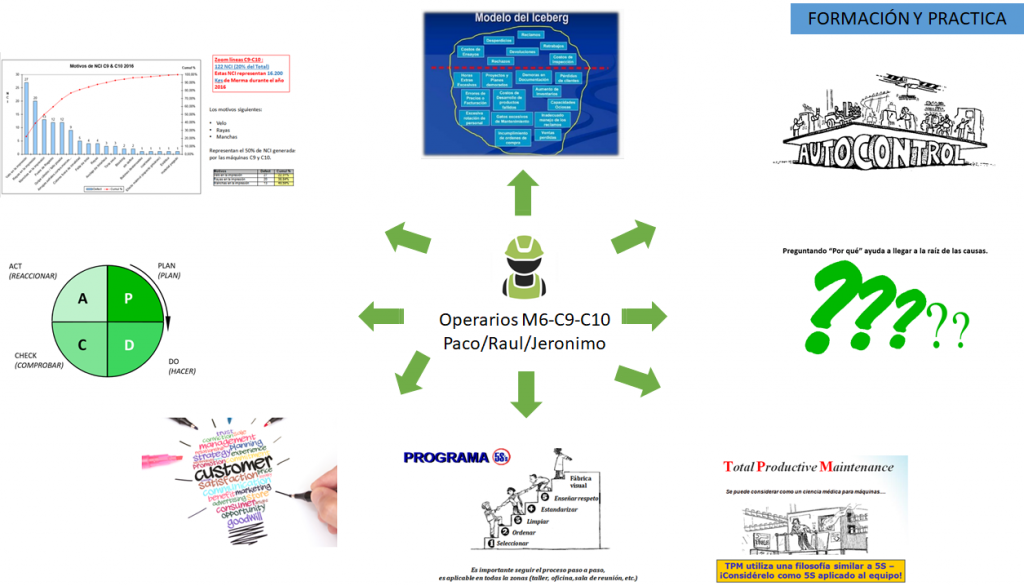
Implementation of Problem-Solving Techniques for Middle Managers
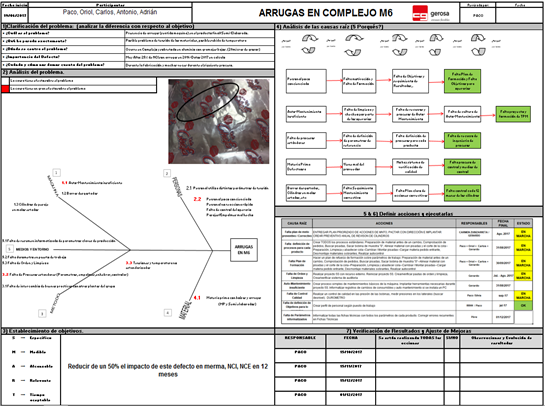
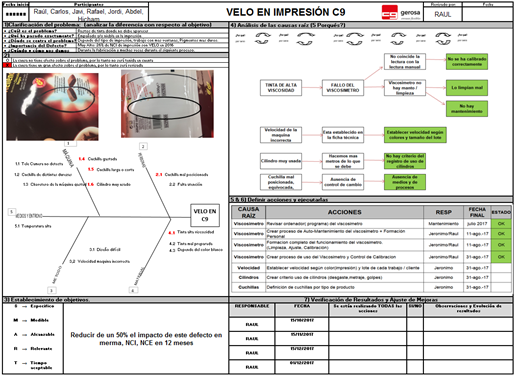
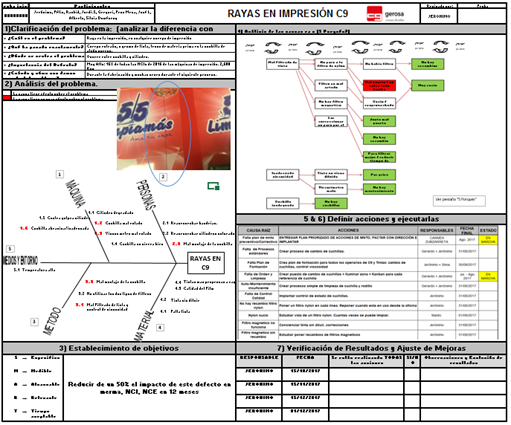
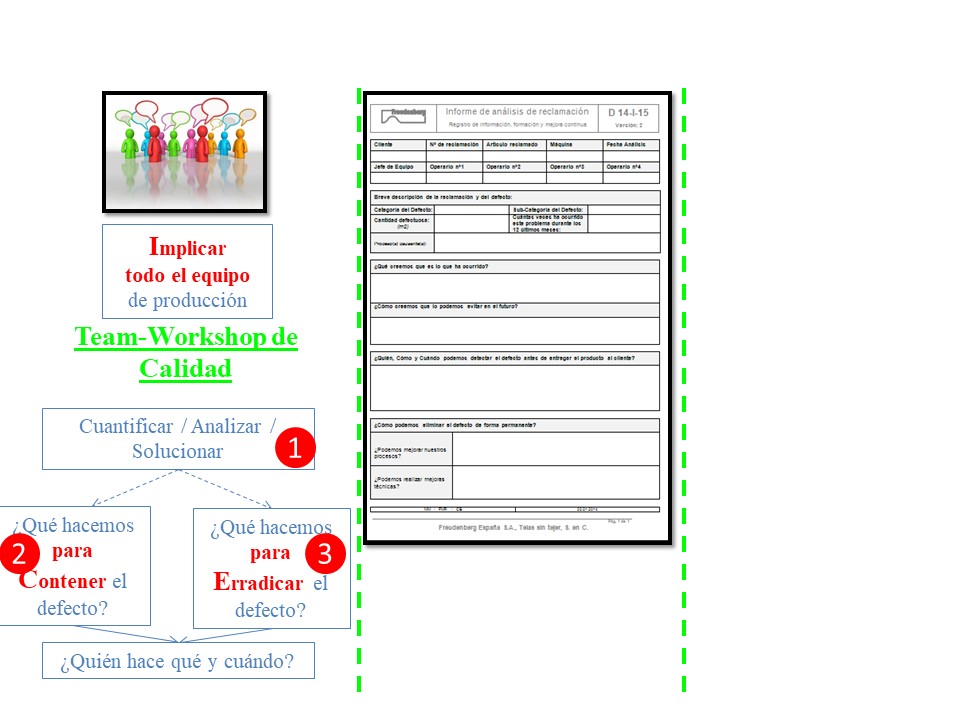
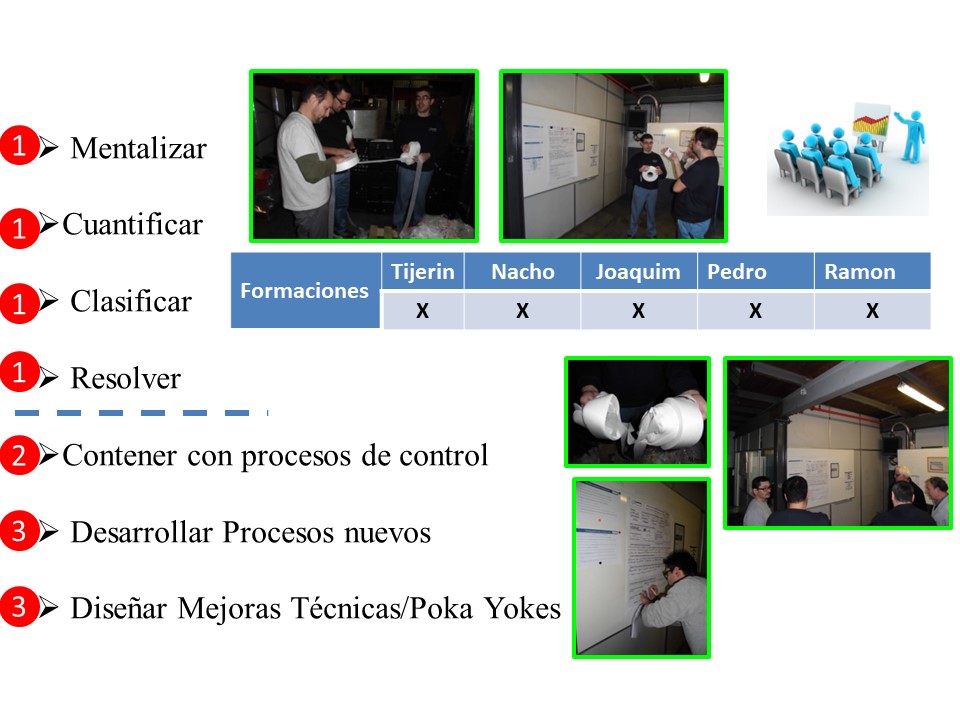
Implementation of Group Problem-Solving Techniques
- PREPARATION FOR ANALYSIS
- INTRODUCTION & PSYCHOLOGICAL PREPARATION OF THE TEAM
- IDENTIFICATION & QUANTIFICATION
- APPROXIMATE SOLUTION TO THE PROBLEM
- CONTAINING THE PROBLEM
- ERRORIZATION OF THE PROBLEM THROUGH EXCELLENT PROCESSES
- ERROR/DICATION OF THE PROBLEM THROUGH BETTER TECHNIQUES
- CLOSING OF THE FISCAL YEAR
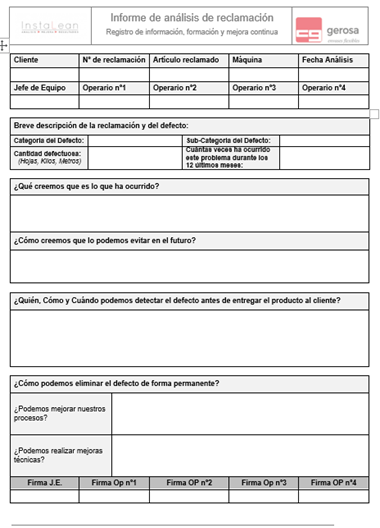
Methodology template
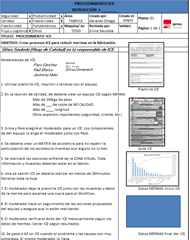
Total Quality: 5S implementations:
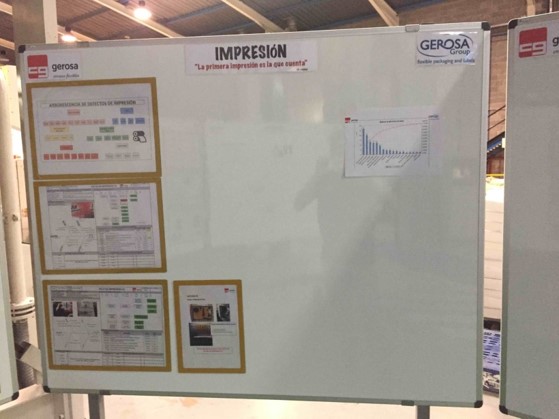
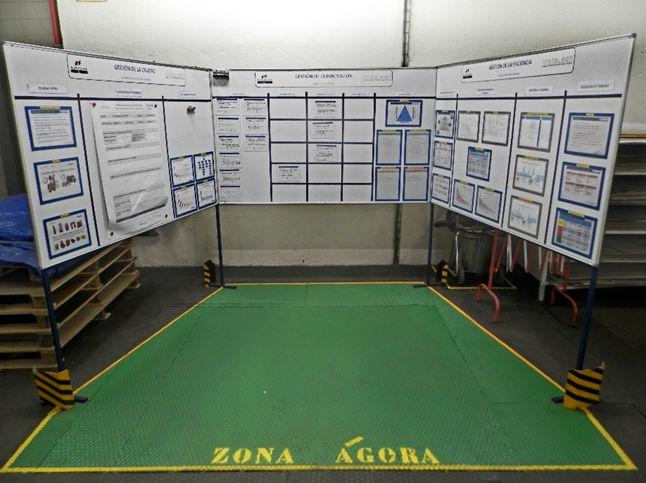
5S Implementations: Agora Zone
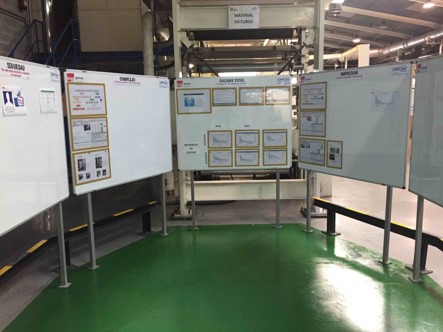
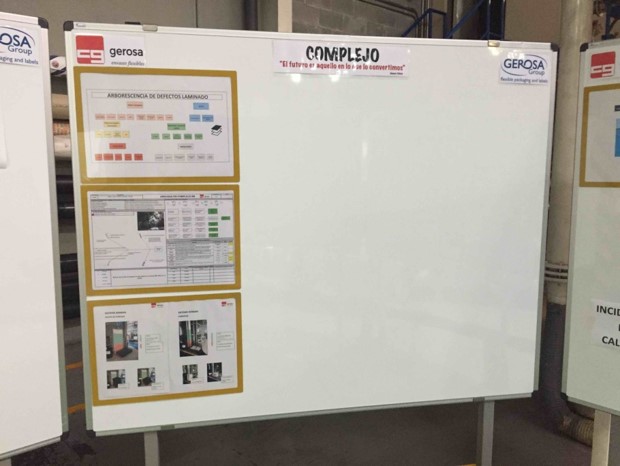
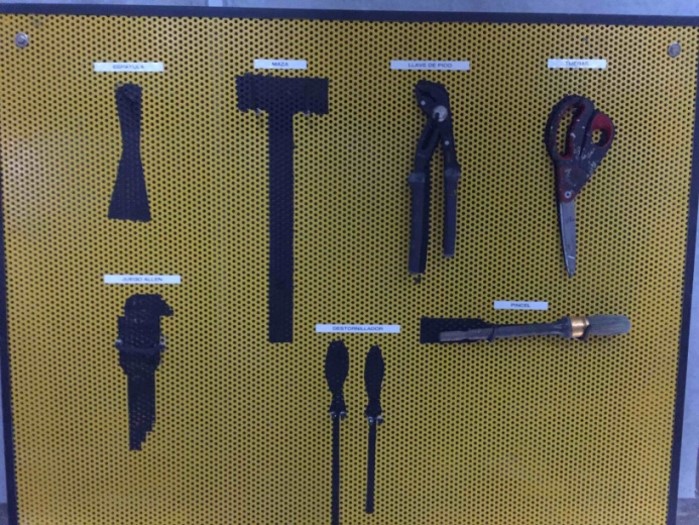
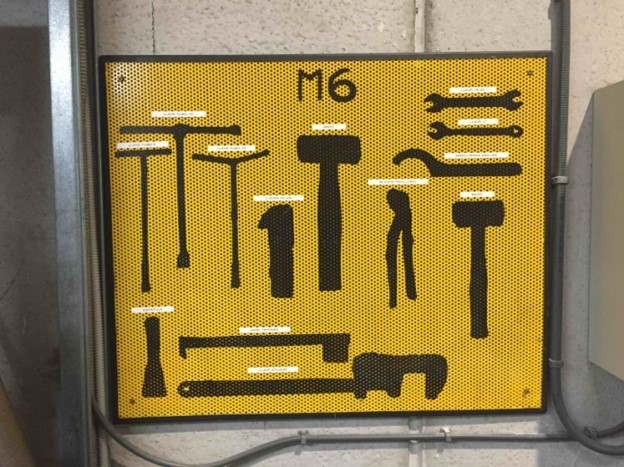
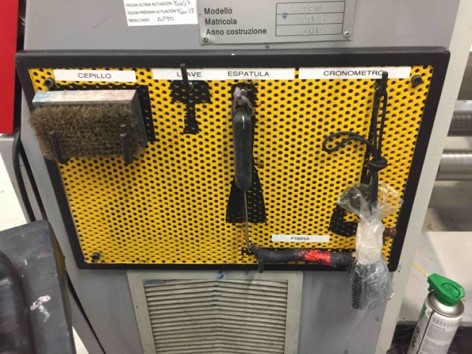
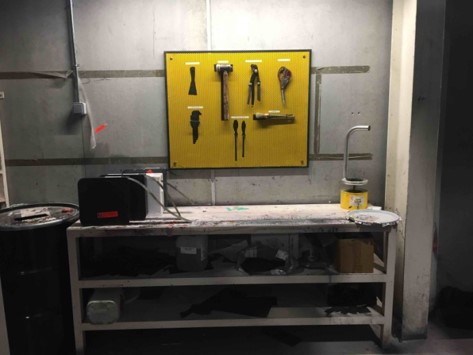
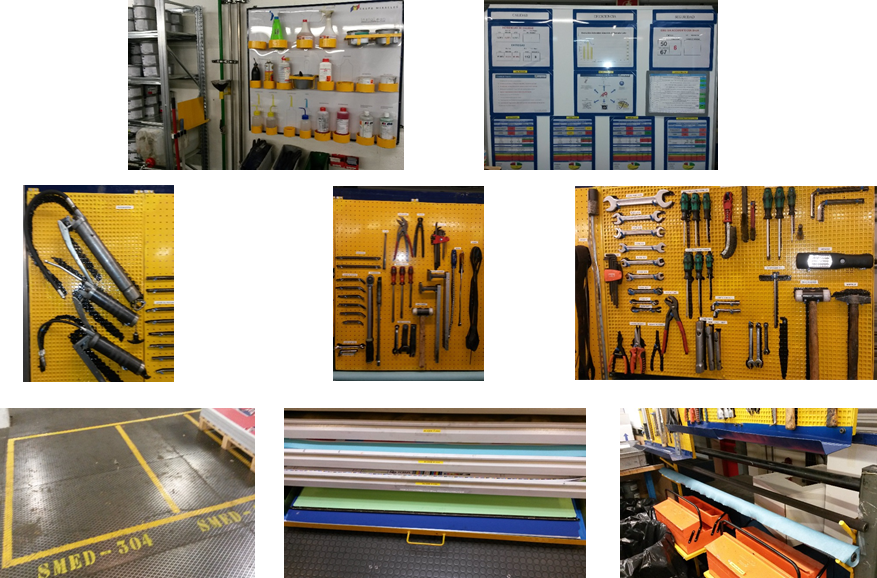
5S Implementations: Tool Panels
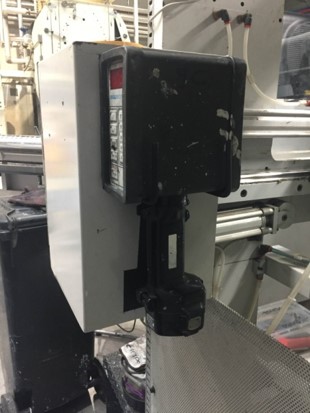
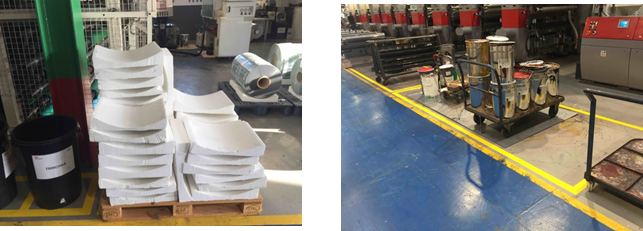
5S Implementations: Kanban Systems + Layout
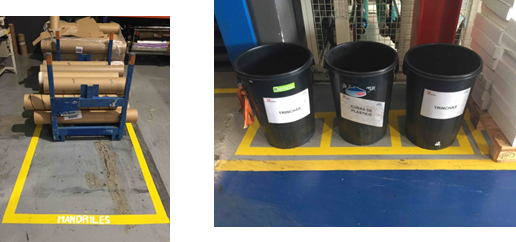
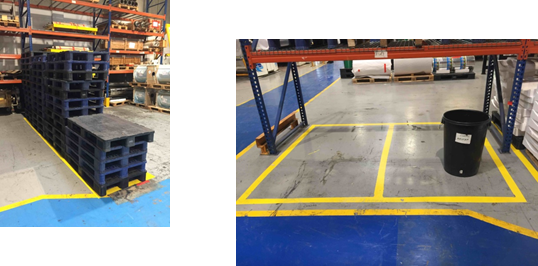
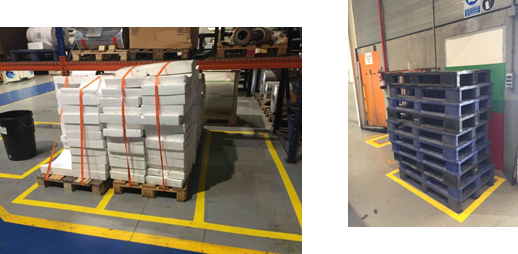
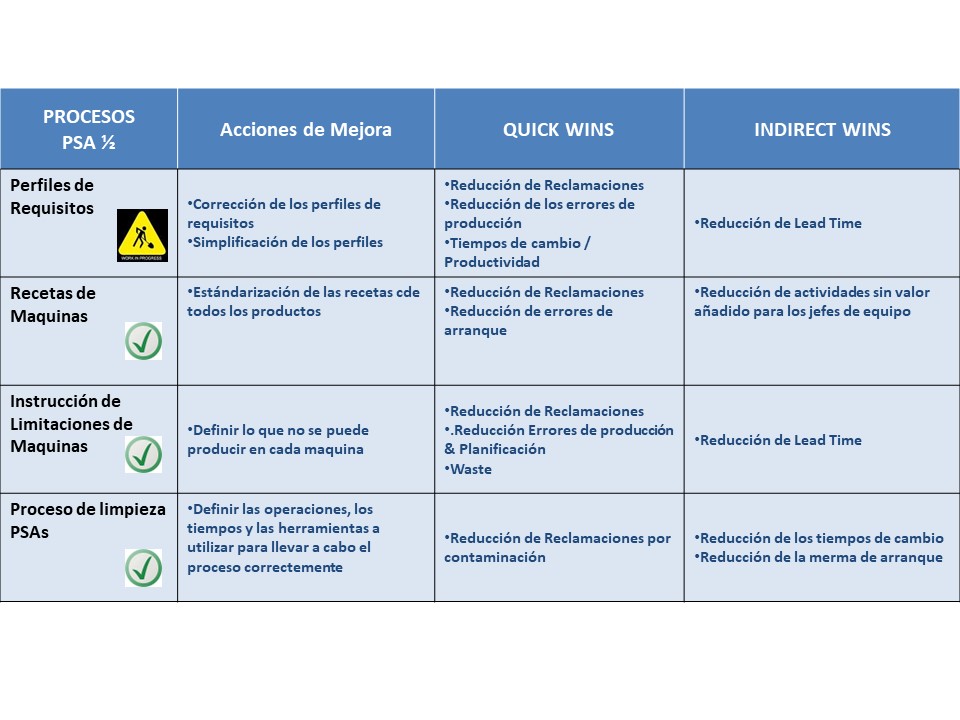
Total Quality: Standard Processes for Machine Start-up, Control and Cleaning
STANDARD PROCESSES FOR ELIMINATING VARIABILITY
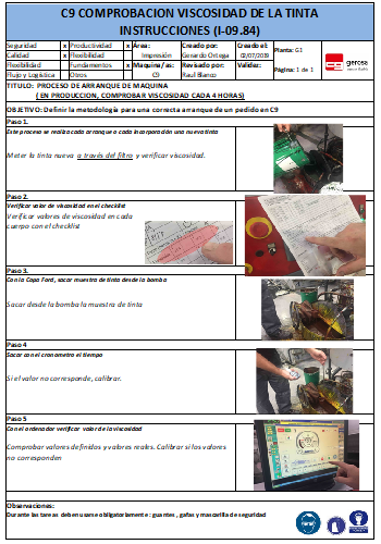
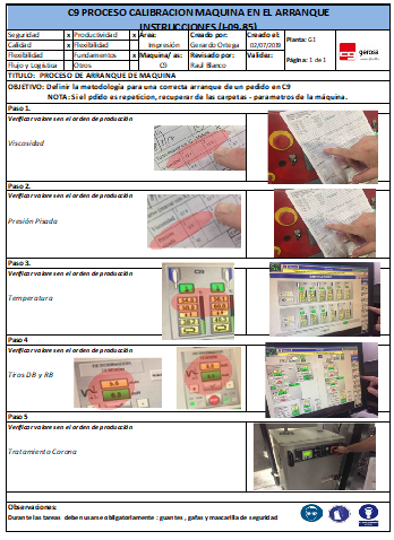
Creation of standard processes to eliminate variability between operators + Conducting training on the machine.
Standard processes C9 and M6
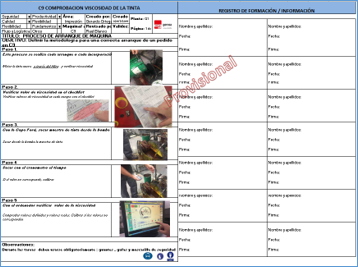
- INK VISCOSITY CHECKING PROCESS
- MACHINE CALIBRATION PROCESS AT START-UP
- ORDER VERIFICATION
- BLADE REPLACEMENT
- BLADE HOLDER CLEANING PROCESS
- BLADE STATUS CONTROL
- BASIC MACHINE MAINTENANCE (Autonomous Maintenance)
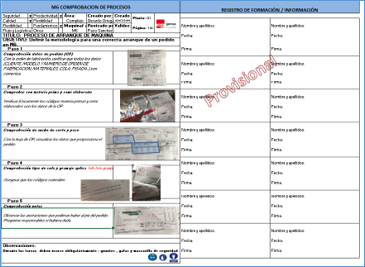
- STARTUP PROCESS / PARAMETERS AFTER A CHANGE
- ORDER VERIFICATION
- MANUAL COLA PREPARATION
- CYLINDER CHANGE – (WEIGHT / ADHESIVE TYPE)
- FOOTPRINT ASSEMBLY PROCESS
- TAKE SAMPLE “0
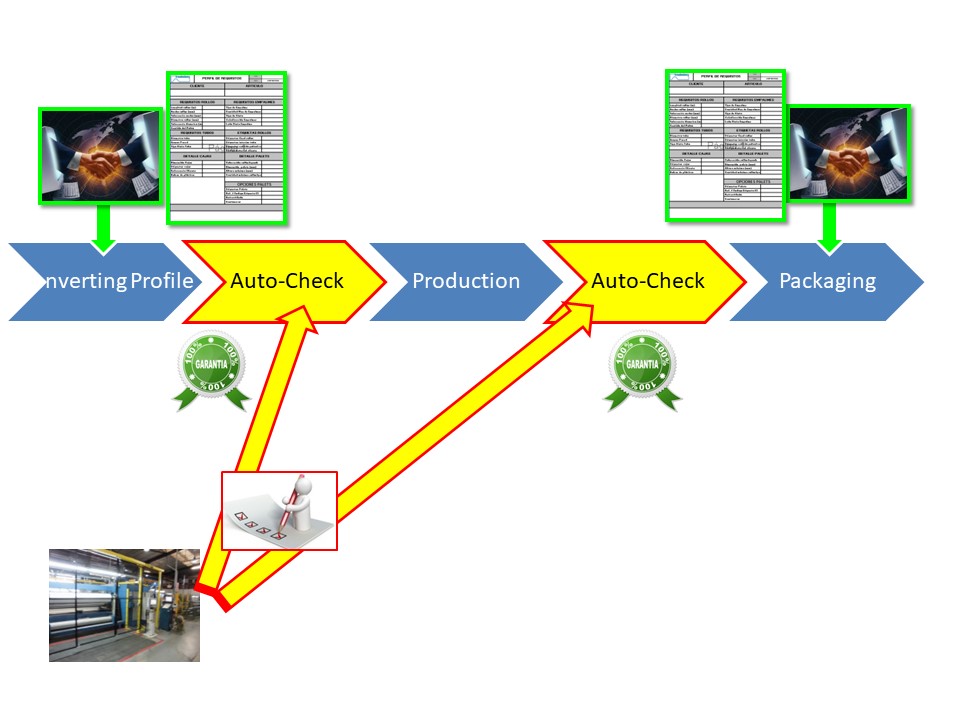
- SELF-CONTROL
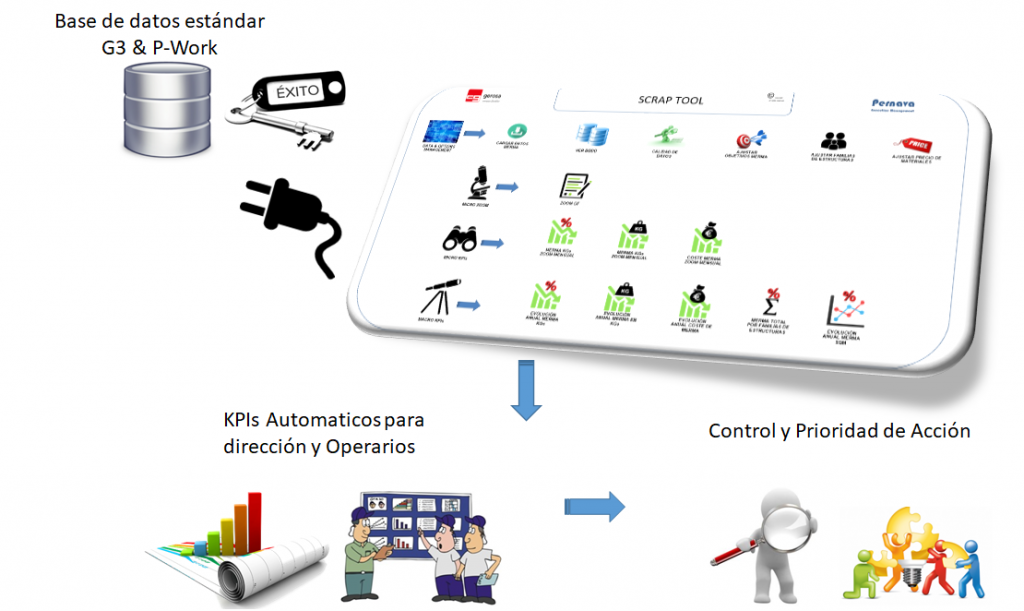
Creation of a custom Reporting Tool
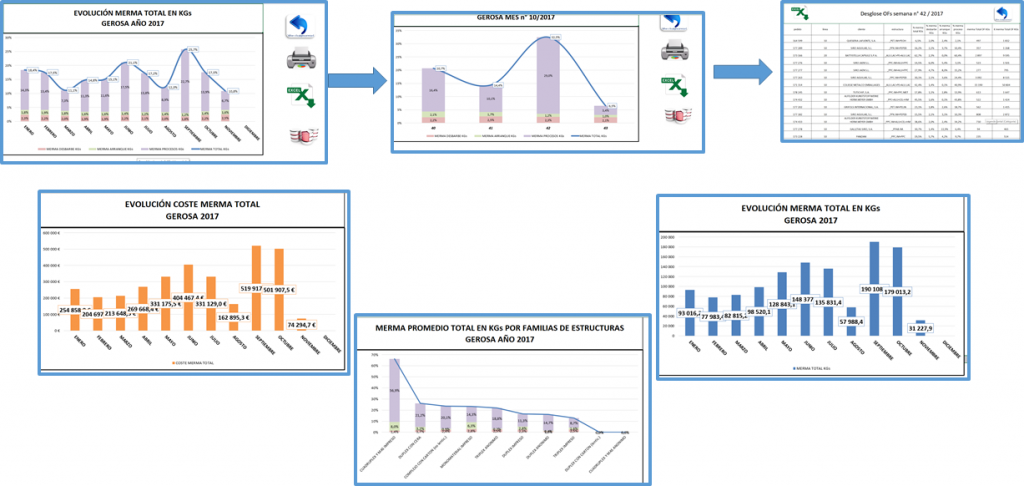
Total Quality Agile Quality Process Management Workflow
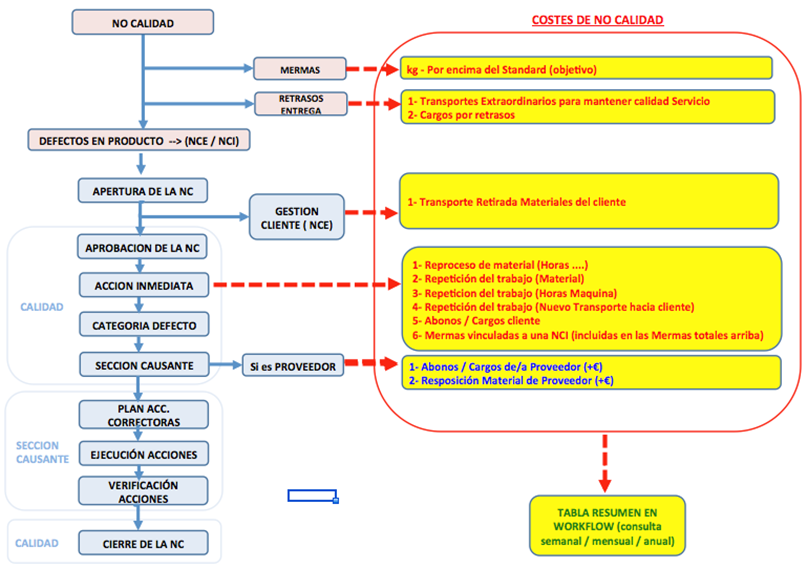
Workflow for NCE / NCI management
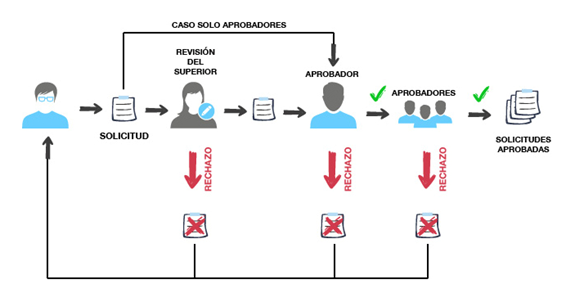
Implementation of workflows for each type of NCE/NCI from detection to resolution by the responsible section, including the different approval steps.
Definition of the Claims Management Process
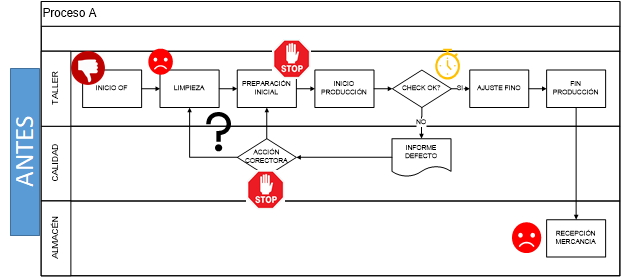
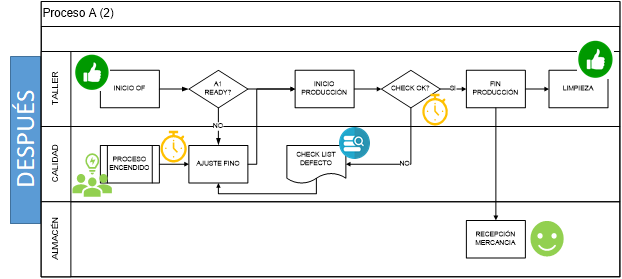
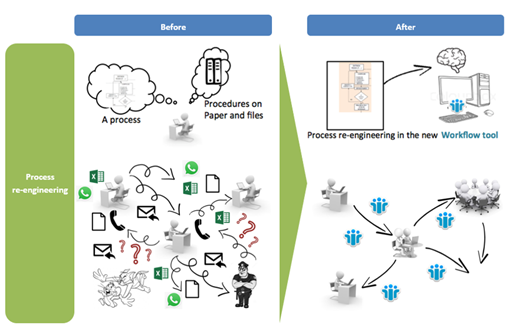
Workflow: Before and After
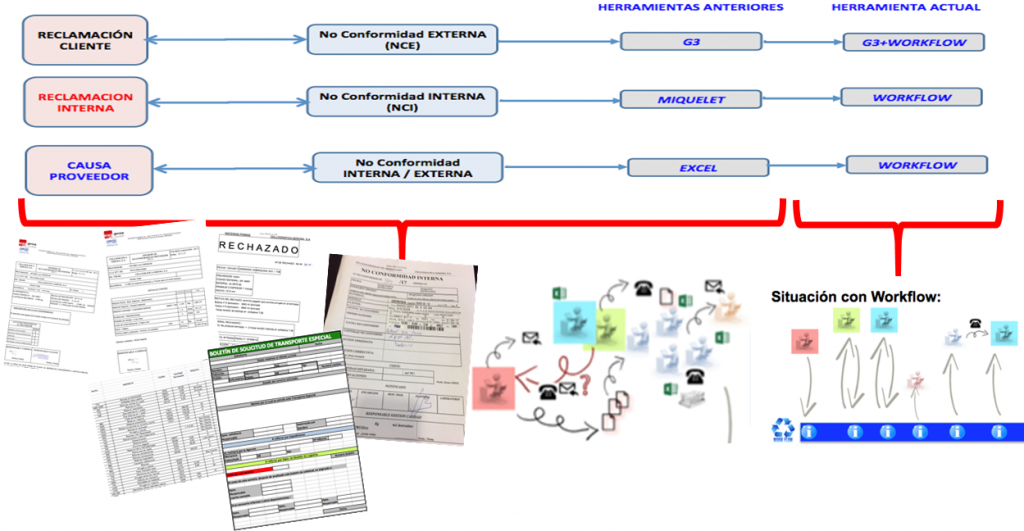
Complete NCE management flow with Lean technique integration
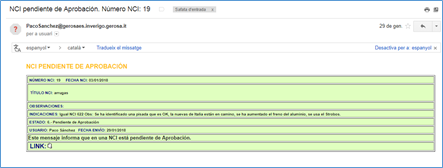
Step 1: NCE Opening by the Salesperson
Step 2-3: Approval & Investigation Flow to the Causing Section
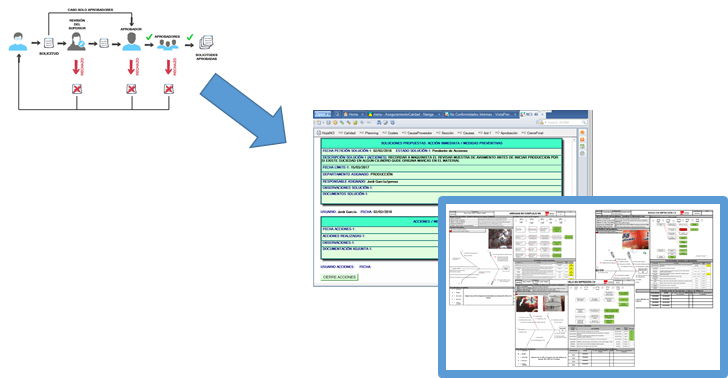
(A3 + Ishikawa + PDCA)
Results of Methodology A3 with Managers: TOTAL NCIs
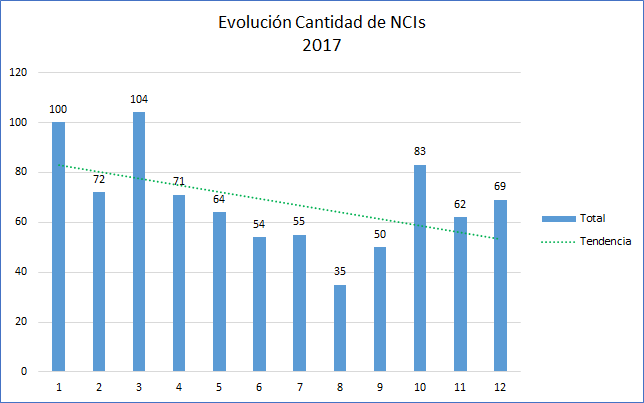
Evolution of the number of NCIs
2017
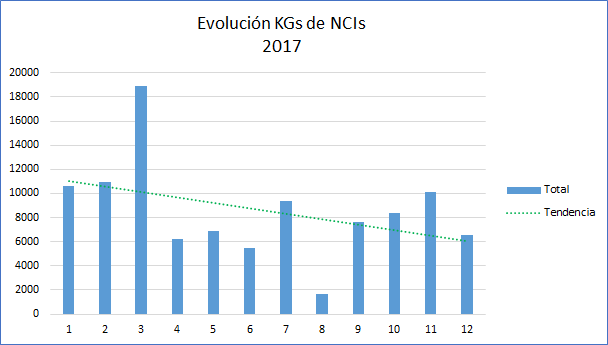
Evolution of NCIs (kg)
2017
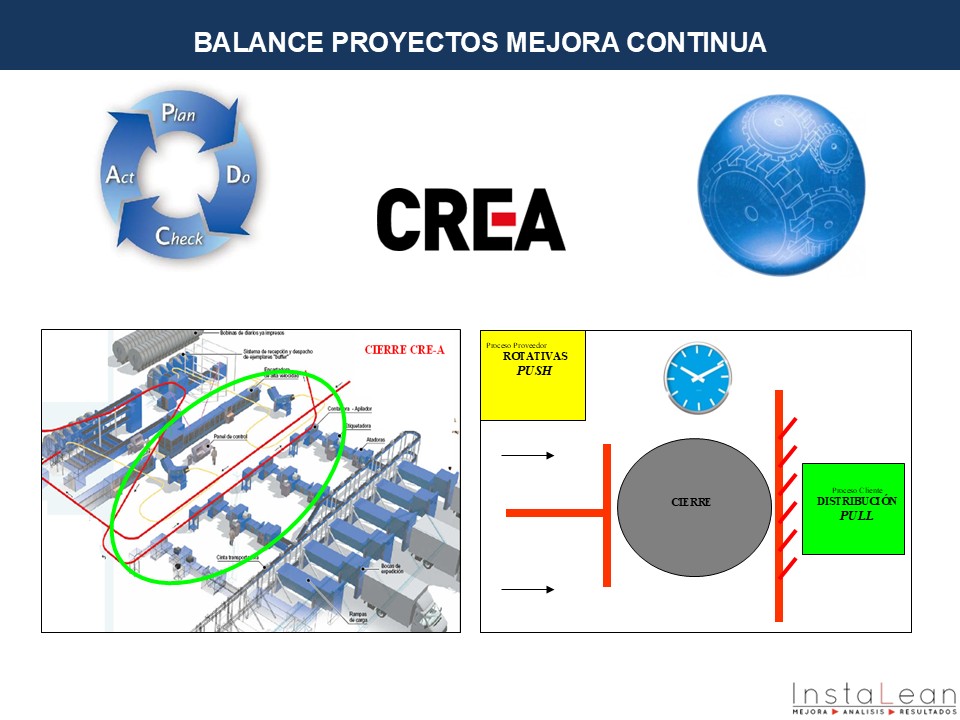
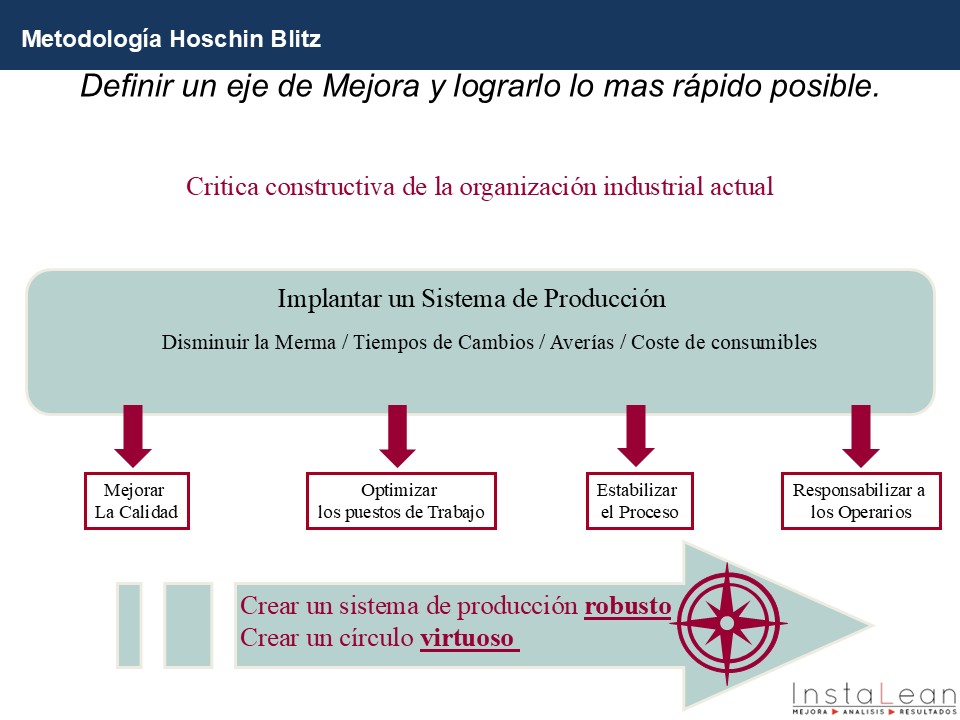
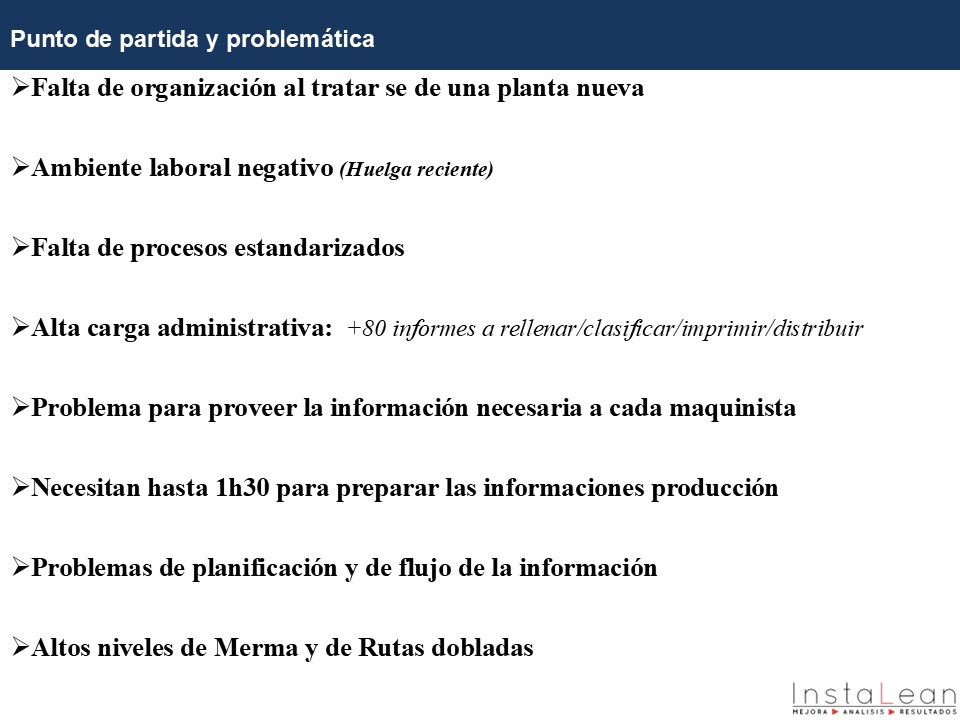
How to divide by 3 the Scrap of your most valuable Products?
Latest Success Story: Reducing by 3 the waste in a production section with higher value-added products. Undoubtedly, this type of project and achievement (€150,000-€200,000/year in reduced direct costs) is among the most complex because it requires integrating up to 7 improvement levers. Quality is the ultimate result of these ingenious production systems.
Last Success Story Divide by 3 the Scrap of a production plant with the most value added products. Undoubtedly this type of project and achievements (150-200K€/year of direct costs) are the most complicated because they require coupling a variety of levers for improvement. Quality being the ultimate result of these ingenious production systems.
Results achieved
Defined Production System
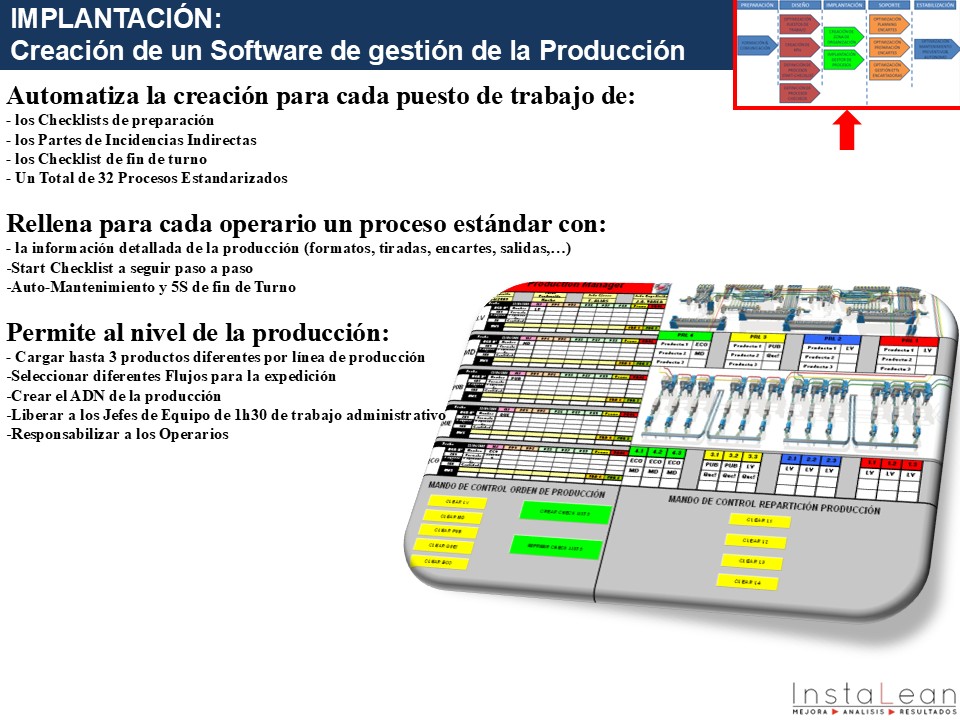
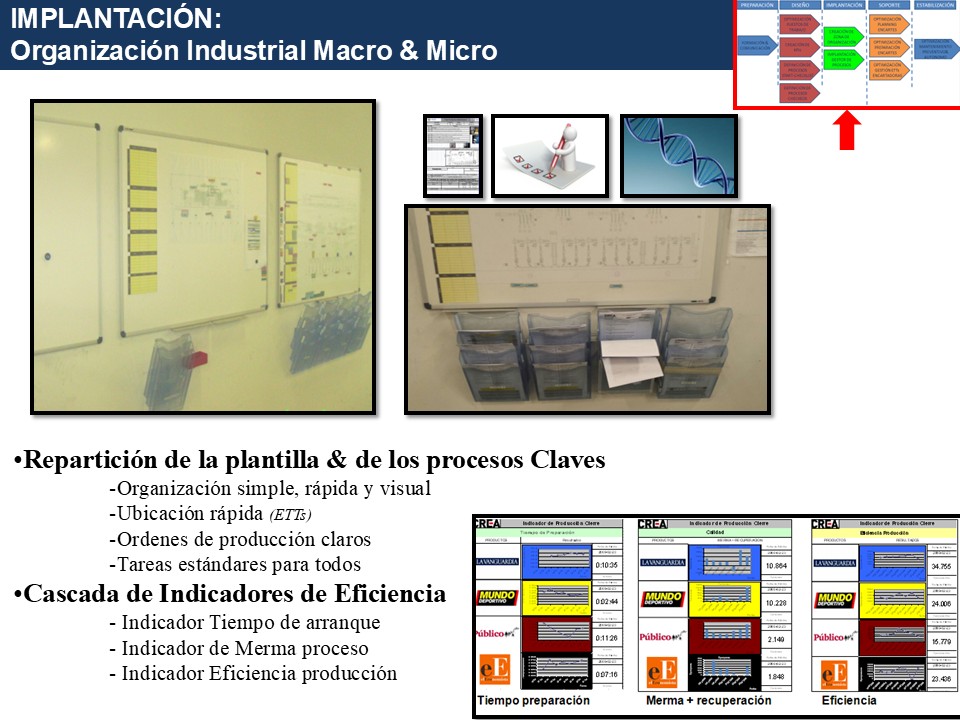
Step 1: Creation of Smart Reporting Tool and Management Visual Zone
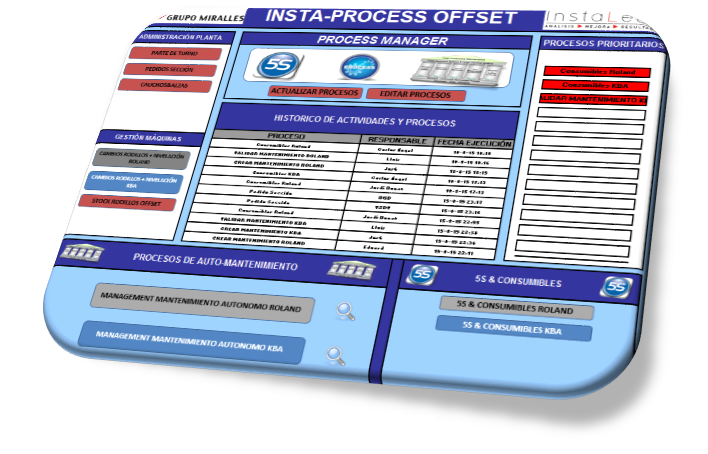
Step 2: Process Management / “Virtual Manager”
Implementation of a “Virtual Manager”
Reminders and alerts about pending processes
More than 20 processes under control: Quality, Safety, 5S, MA, Checklists
SMED Process Continuous Improvement Module
Continuous Process Improvement Module MA
Step 3: Self-Maintenance & Continuous Improvement
Removing the Iceberg of Ignorance
Management of Self-Maintenance by the Operators
Classification of Incidents by Level of Criticality and Impact
Communication between repair shifts
Feedback and Improvement of MA Processes
Continuous Improvement Module with Operator Ideas
Incident Repetition and Response Time (SLA) Reporting
Step 4: Implementation of Excellence in Terms of Management 7S (5+2)
Step 5: Technical improvements for improved quality at the source and a reduction of micro-stops
Upstream Quality Optimization through Machine Optimization and Process Control
Step 6: Organizational Change
Design and Implementation of a More Efficient Organization:
- Specialization
- Reduction of displacements
- Process Standardization
Reduction of variability thanks to the specification of Team leaders
Summary of the Improvement Levers Implemented
Results achieved
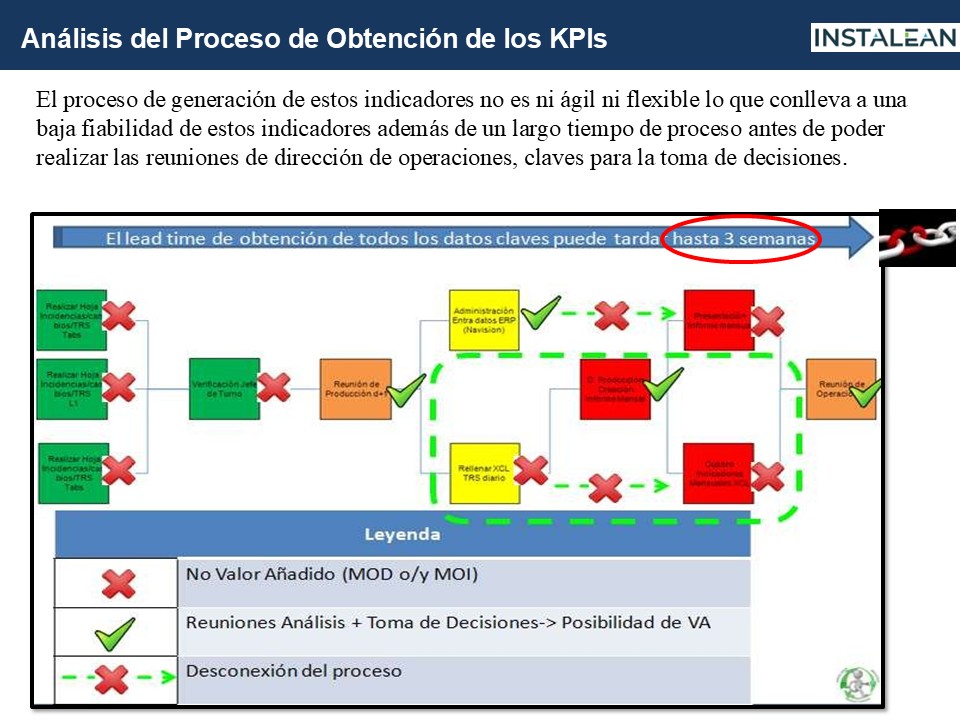
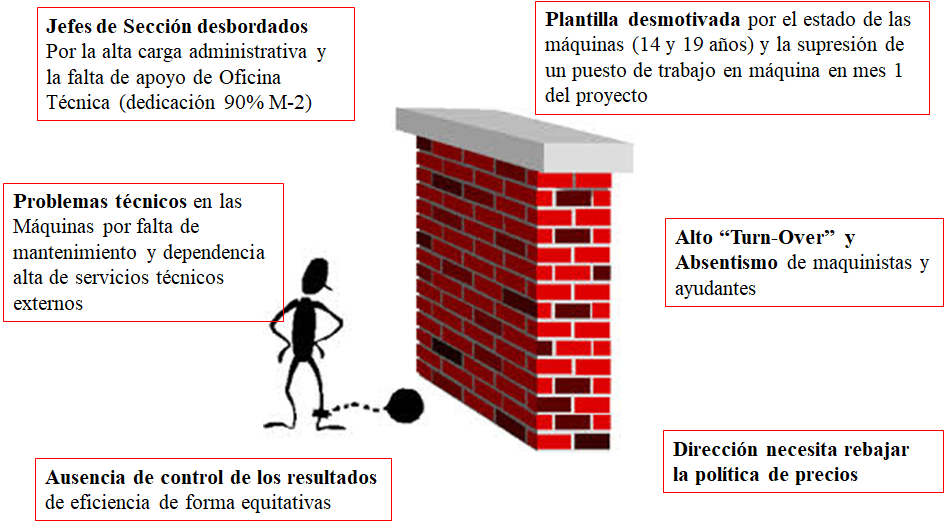
Origins: Obstacles
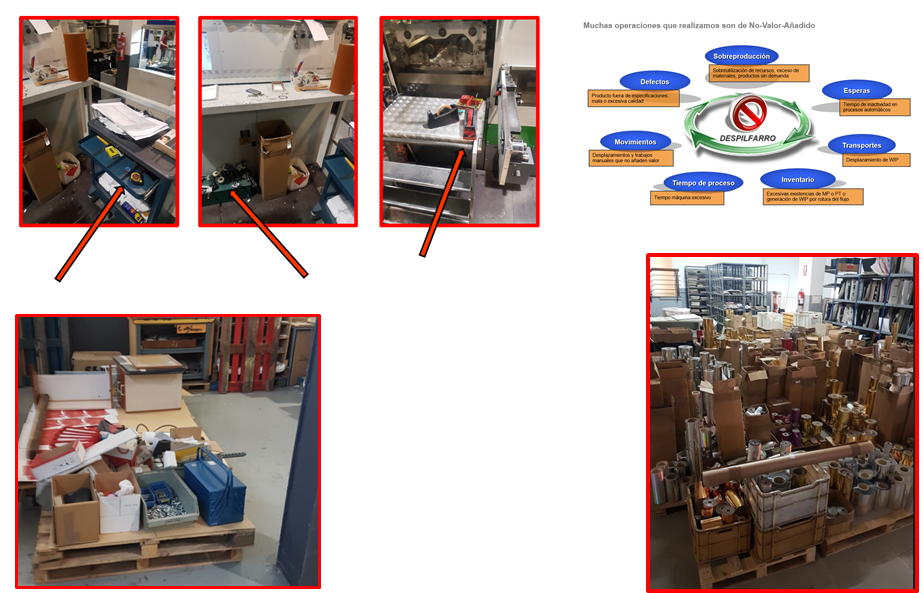
Main wastes identified:
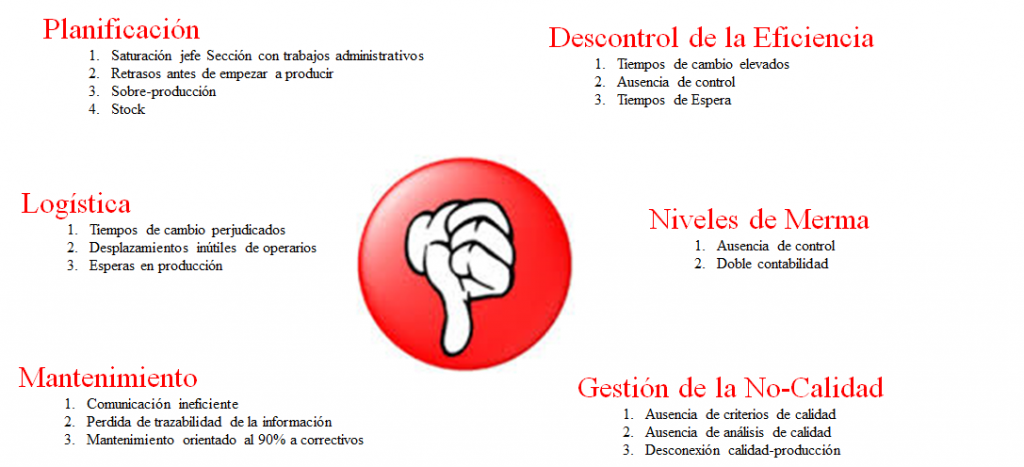
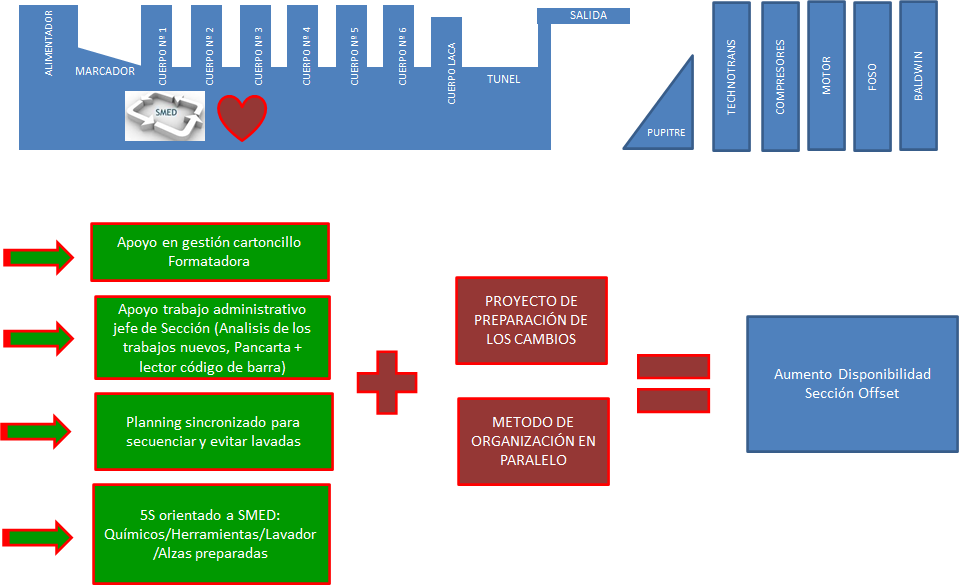
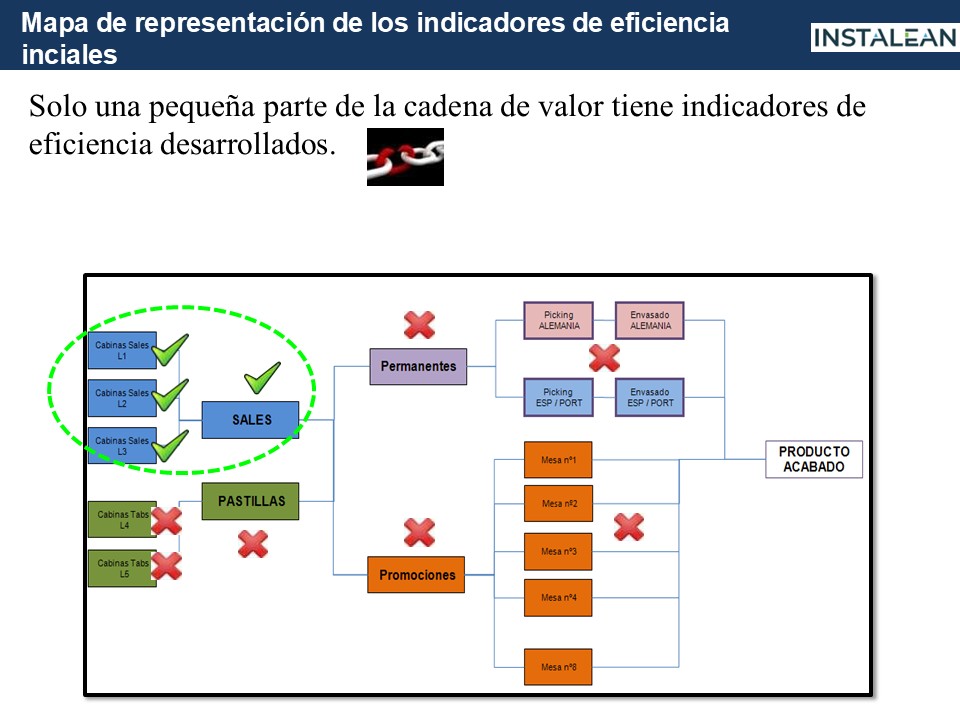
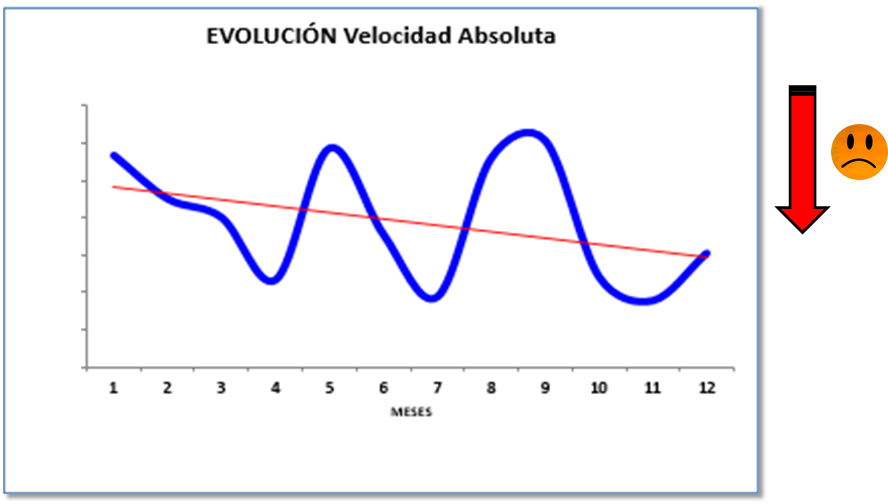
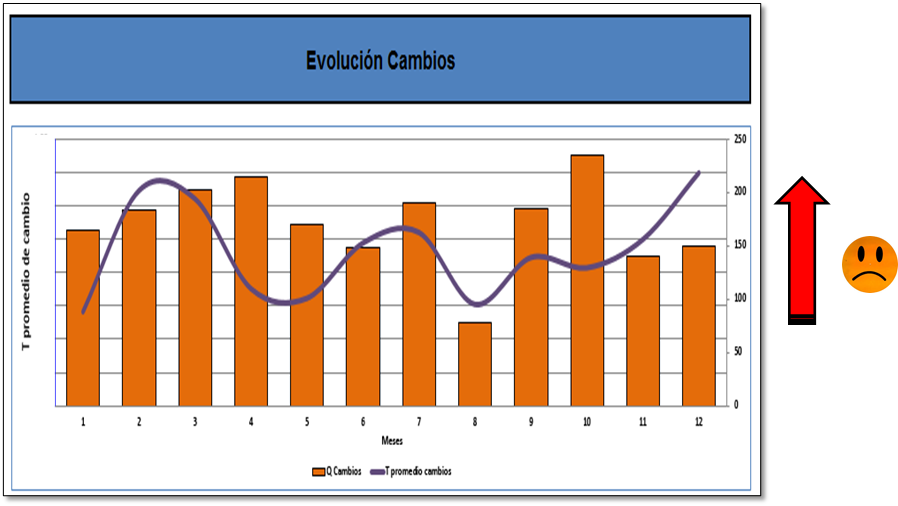
Starting Point of Efficiency
Current status of the changes
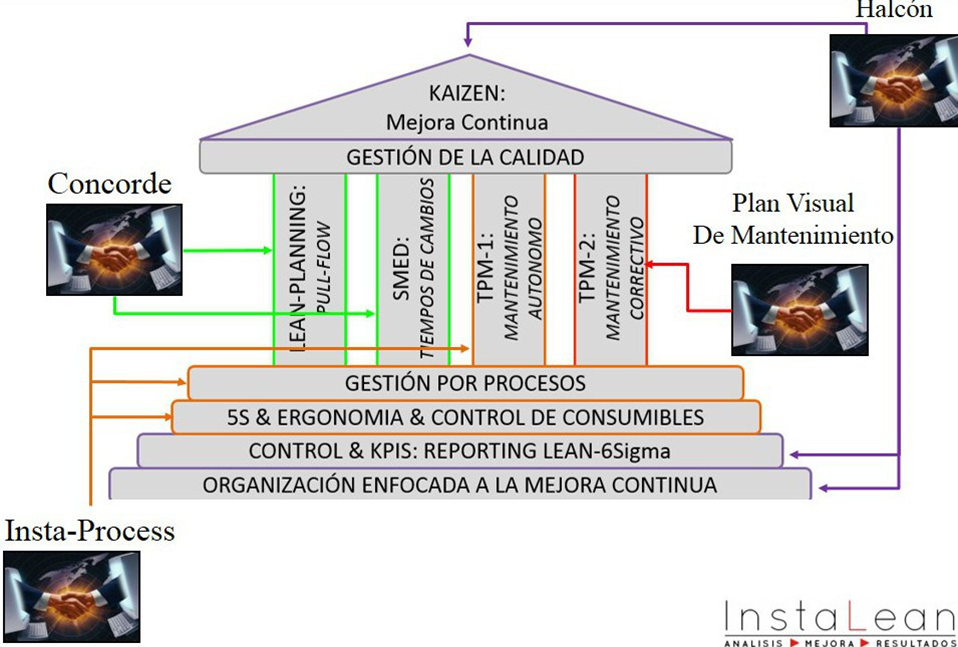
Production System created & used
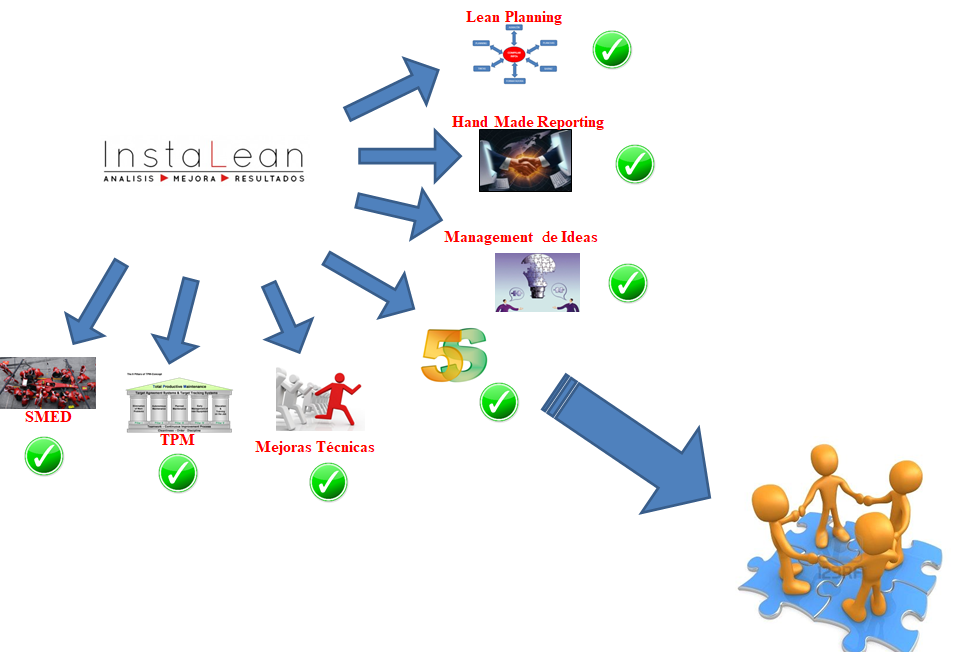
Lean techniques used in the project
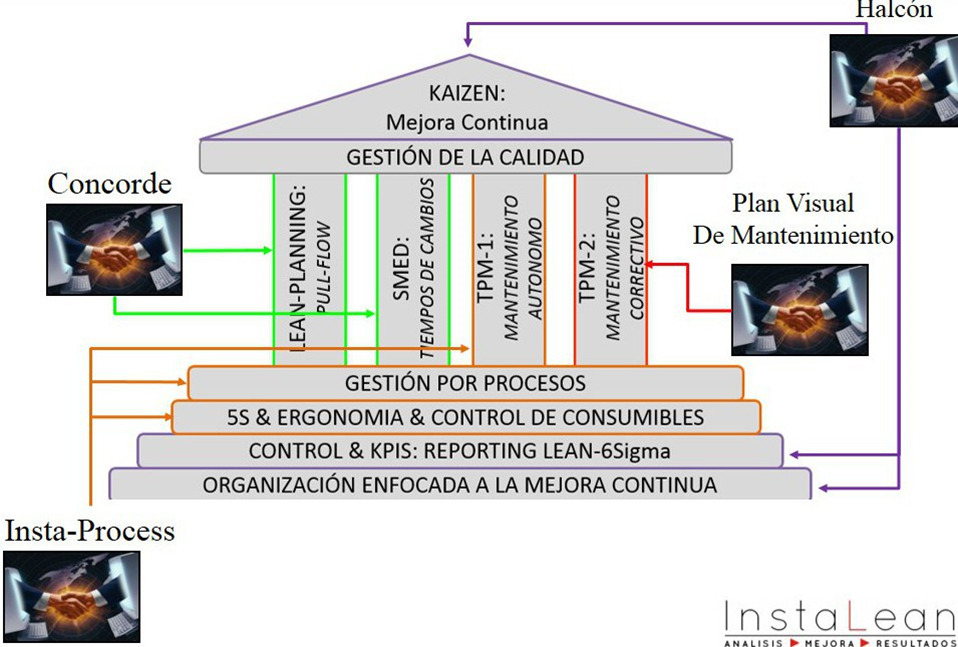
Production Systems VS Agile Systems
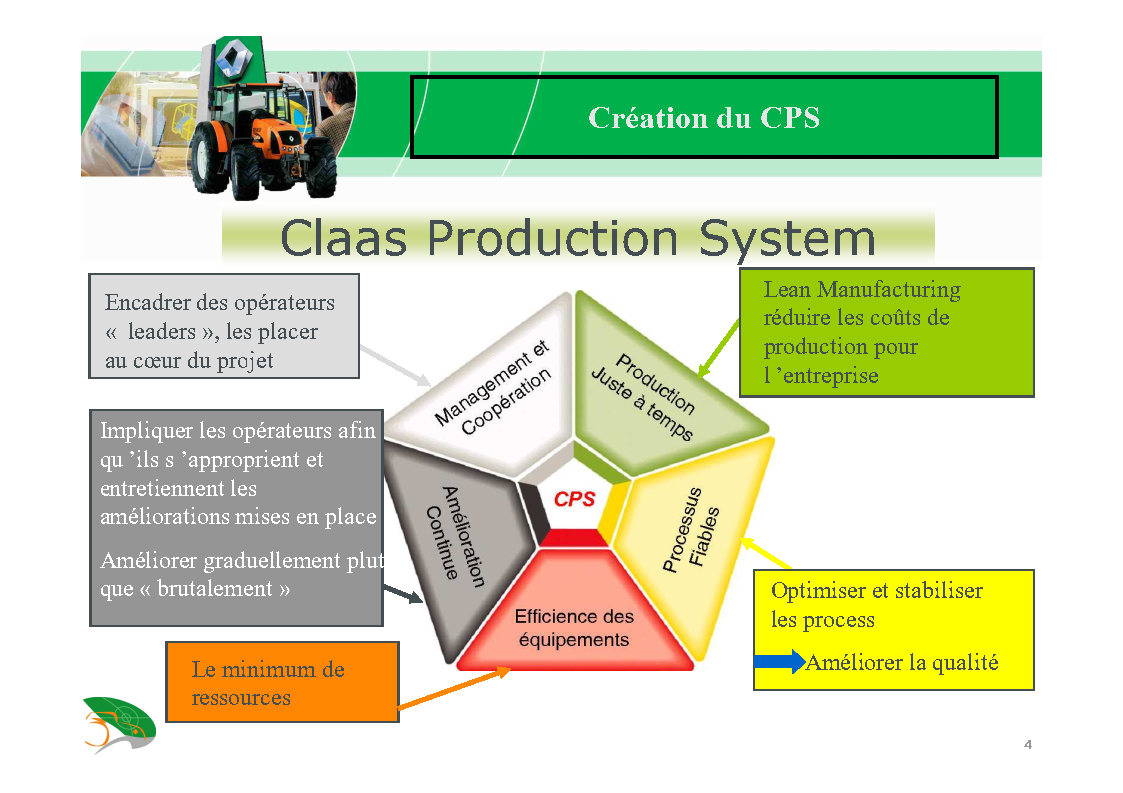
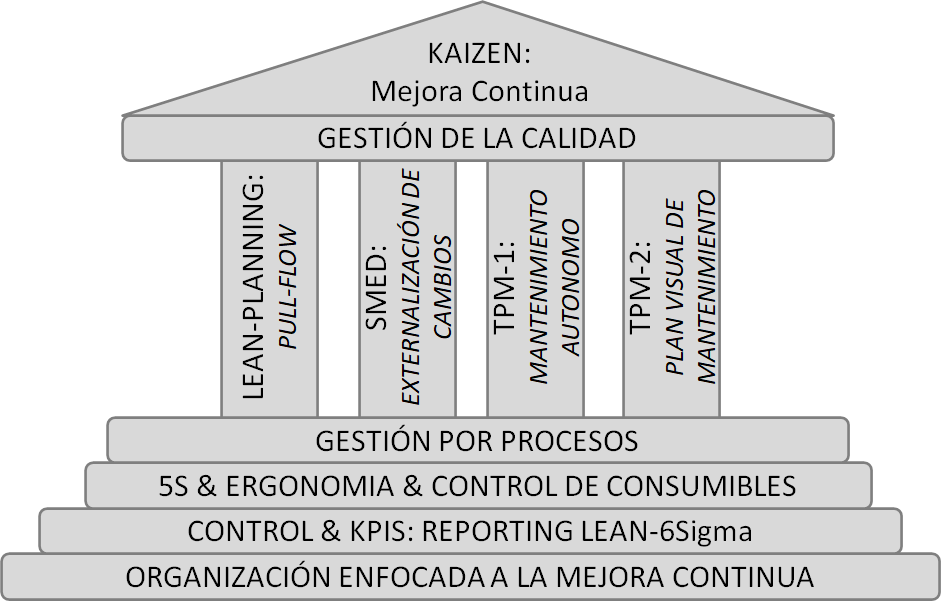
Production System created
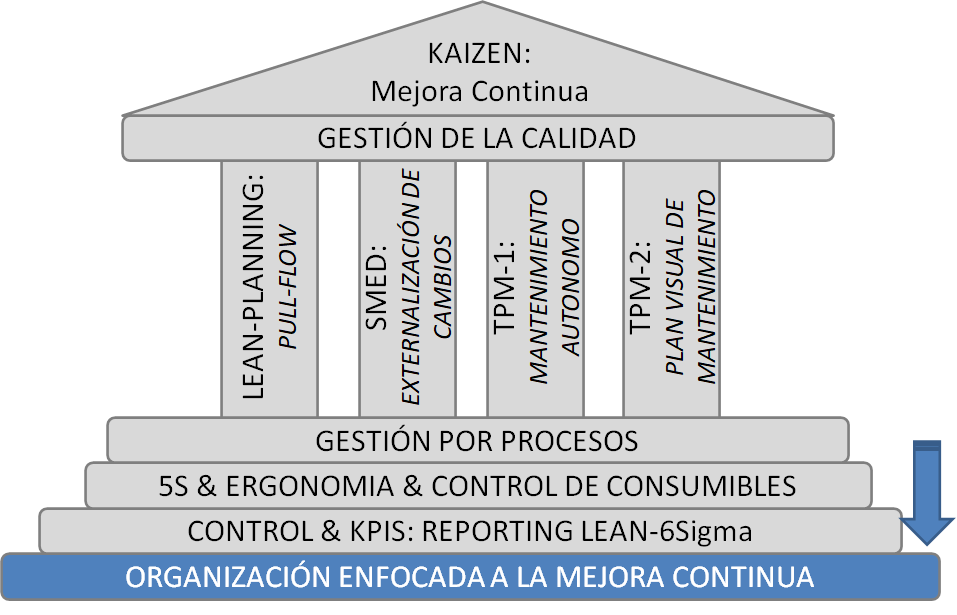
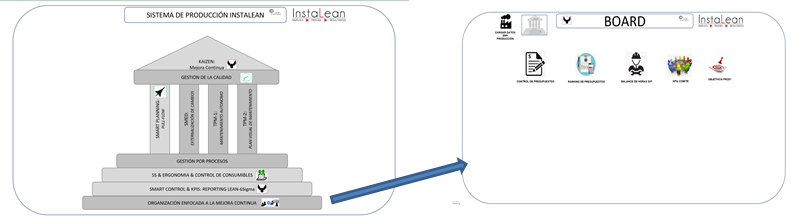
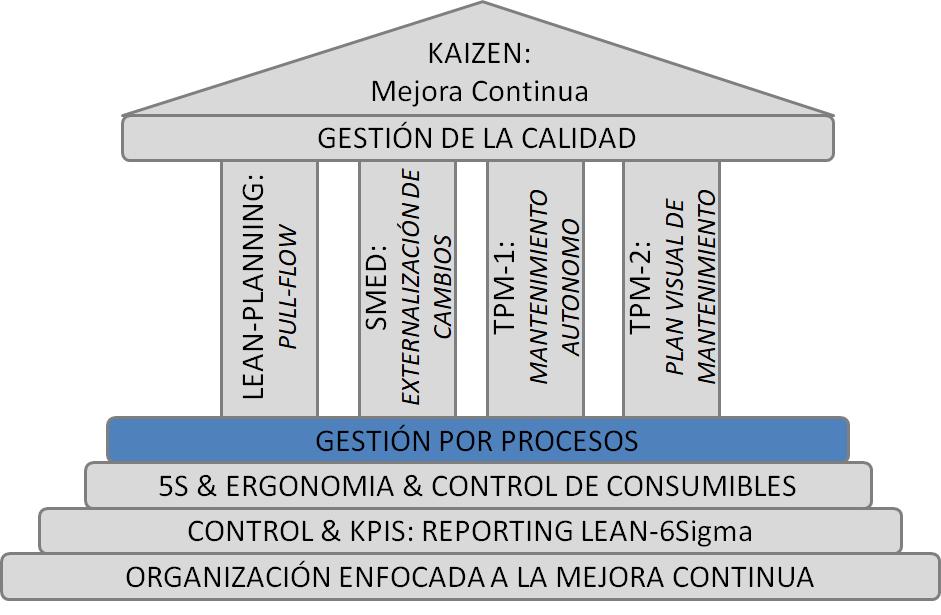
ORGANIZATION FOCUSED ON CONTINUOUS IMPROVEMENT
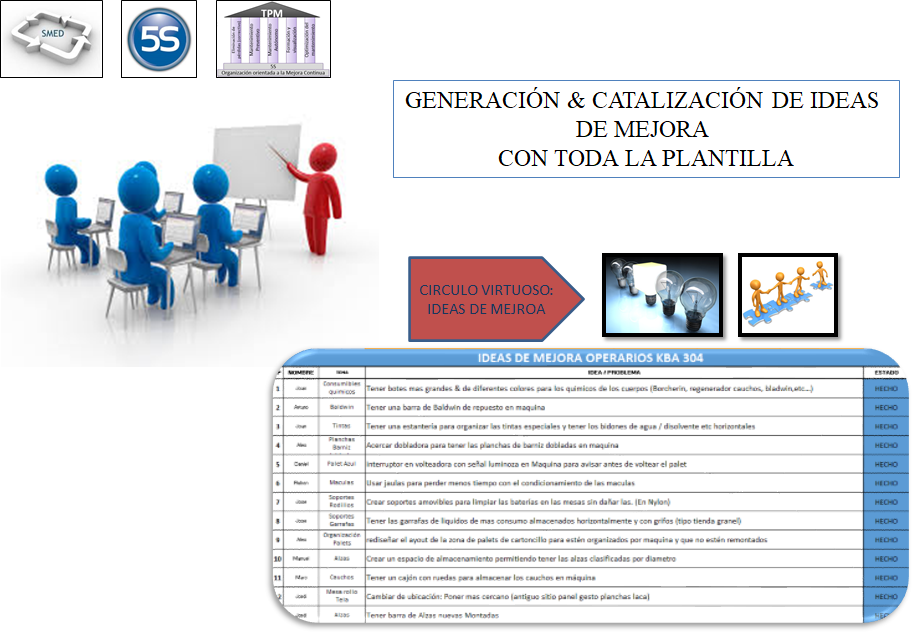
ORGANIZATION FOCUSED ON CONTINUOUS IMPROVEMENT
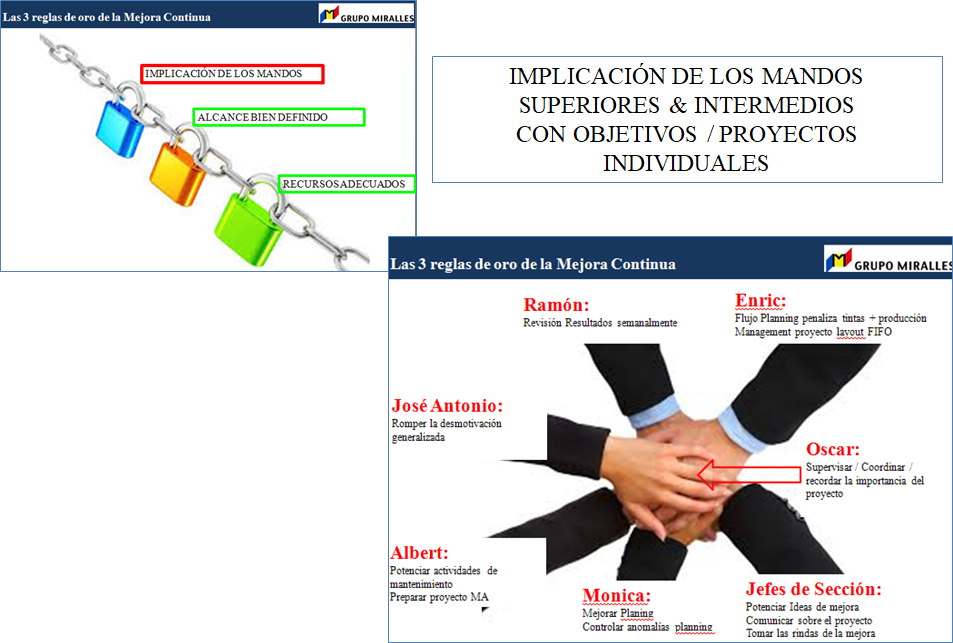
Production System created
CONTROL & KPIS: LEAN-6Sigma REPORTING
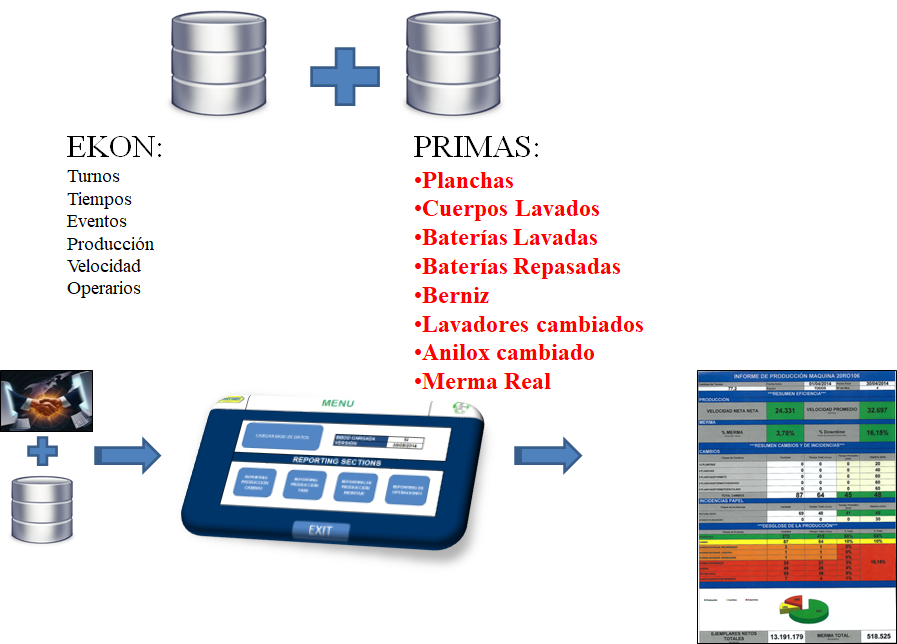
Flash results – visual management
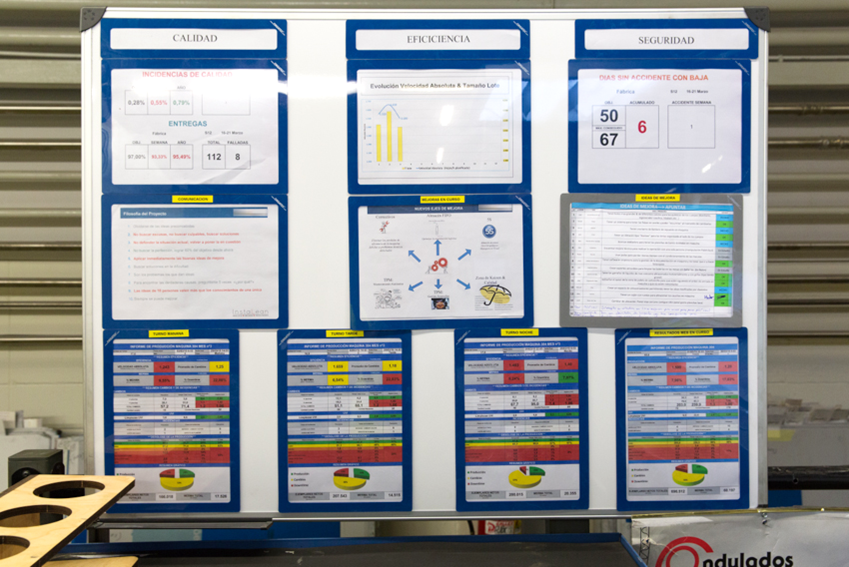
CONTROL & KPIS: LEAN-6Sigma REPORTING
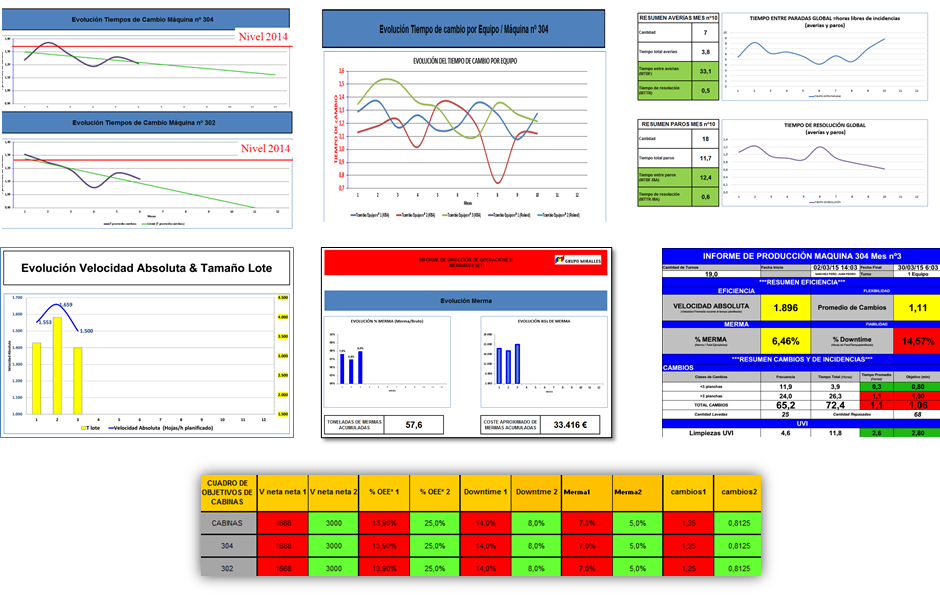
Production System created
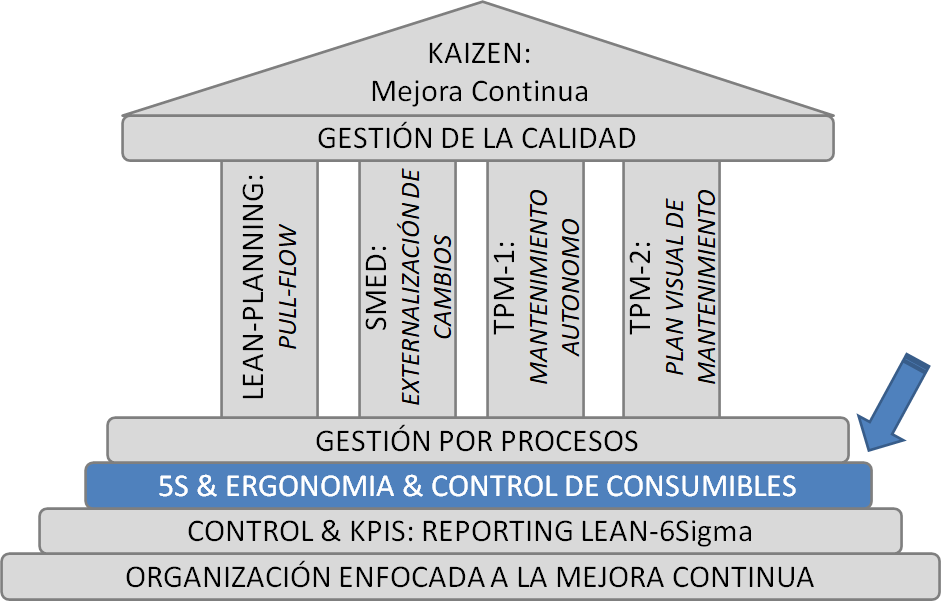
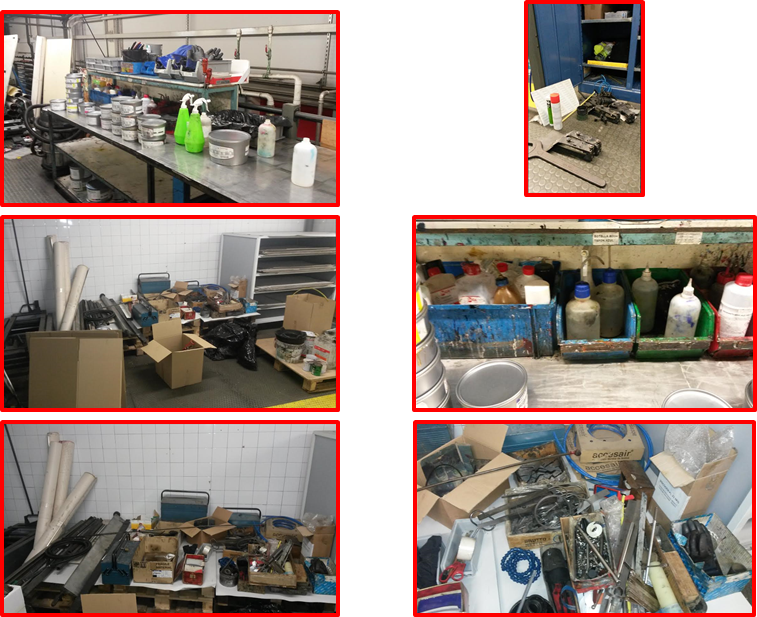
5S & ERGONOMICS & CONSUMABLES CONTROL
BEFORE
5S & ERGONOMICS & CONSUMABLES CONTROL
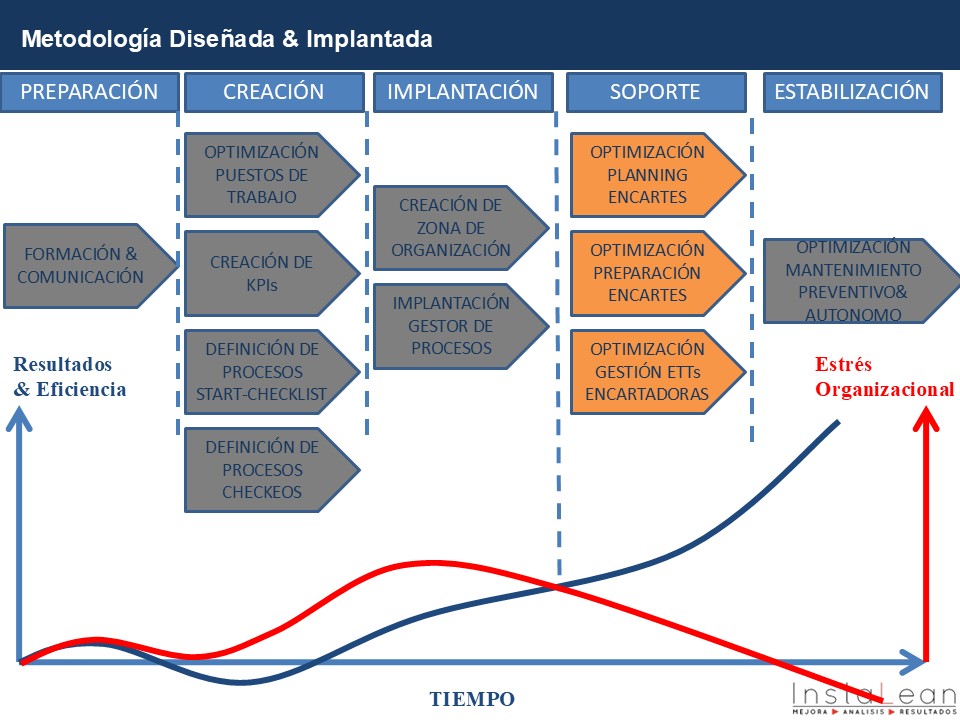
Transformation Methodology
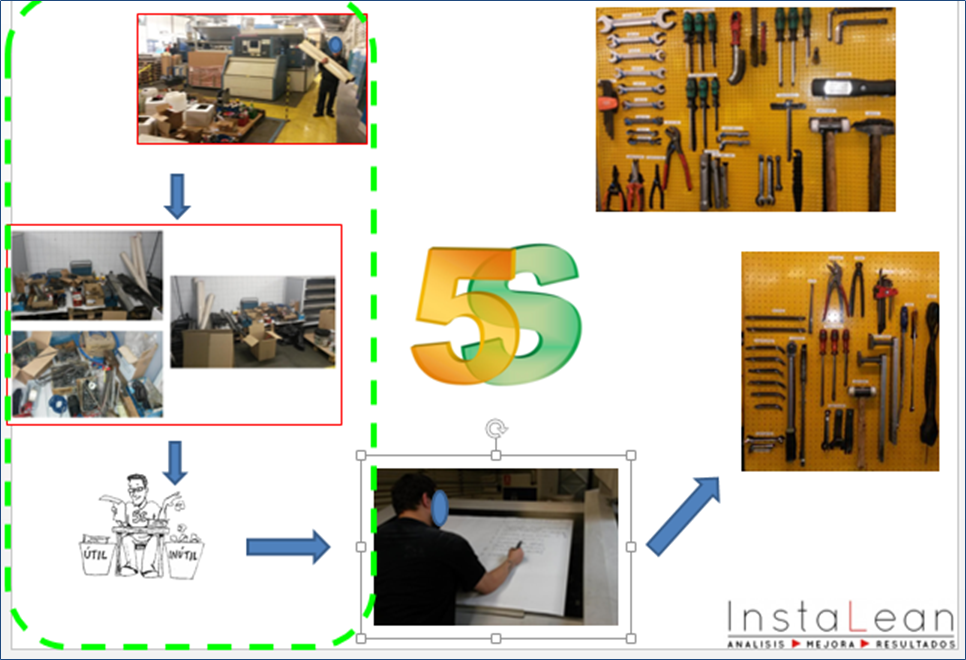
5S & ERGONOMICS & CONSUMABLES CONTROL
AFTER
Production System created
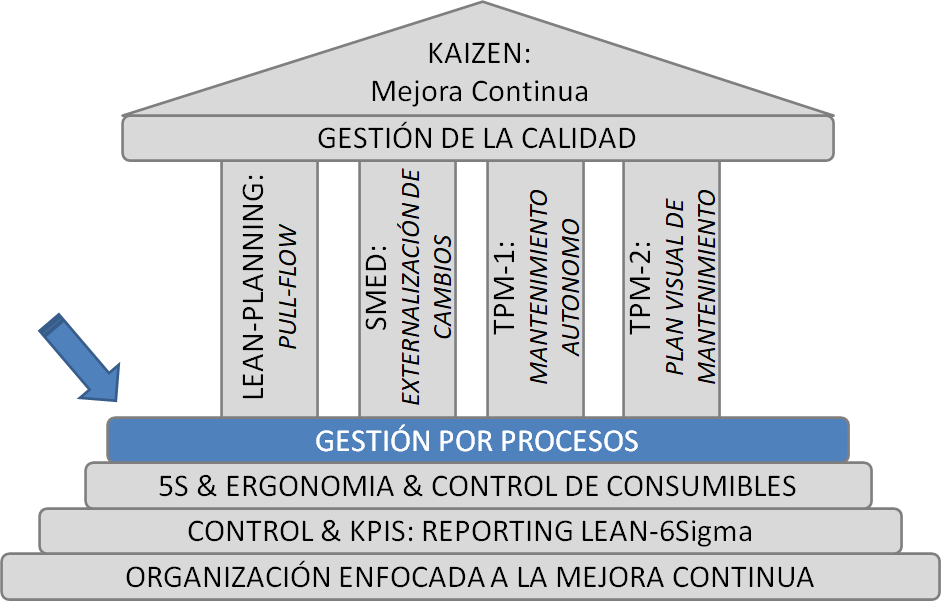
Current focus of work: Creating a production system
Moving from an organization where we rely on excellent people and mediocre processes to an organization with excellent processes and average people.
Creation of a custom-made process manager
- Consumables Ordering Processes
- Roller management processes
- Shift change reports
- Staff allocation parts
- Battery leveling control processes
- 5S Checklists / Consumables
- Autonomous Maintenance Management Modules
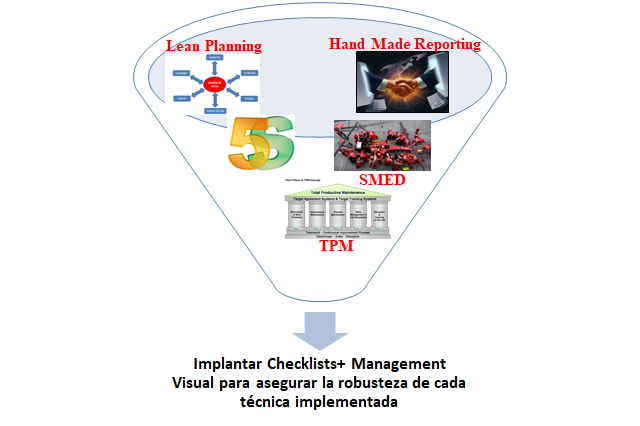
Planning the management tasks for each Lean technique
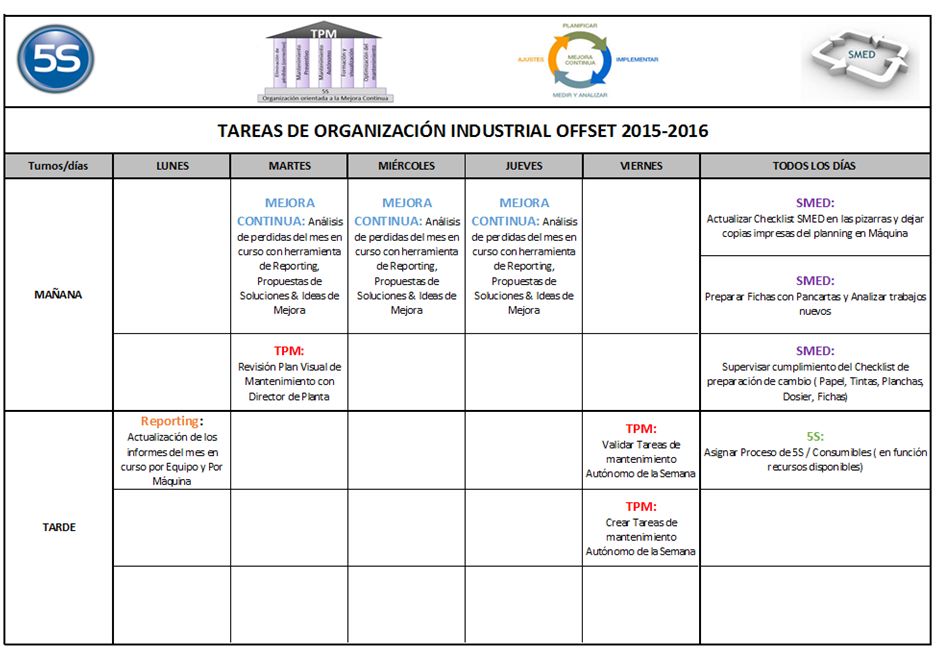
Production System created
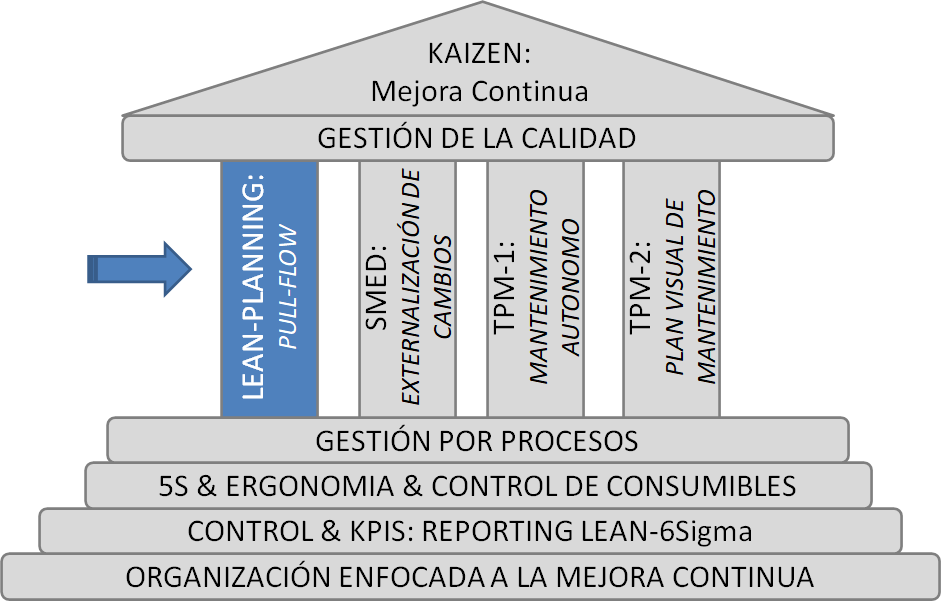
Planning Management Process Map: VA /NVA
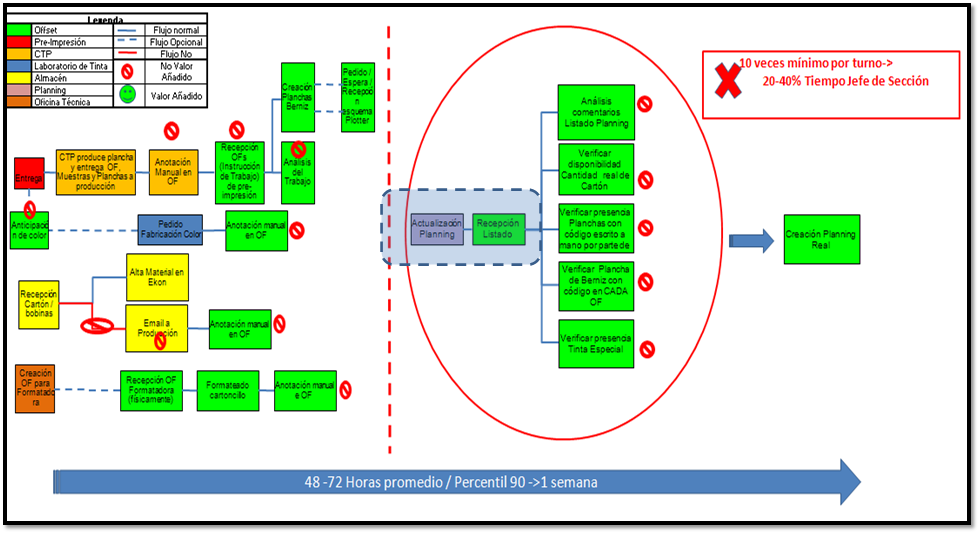
Stock generator, overproduction, waiting times, general dissatisfaction
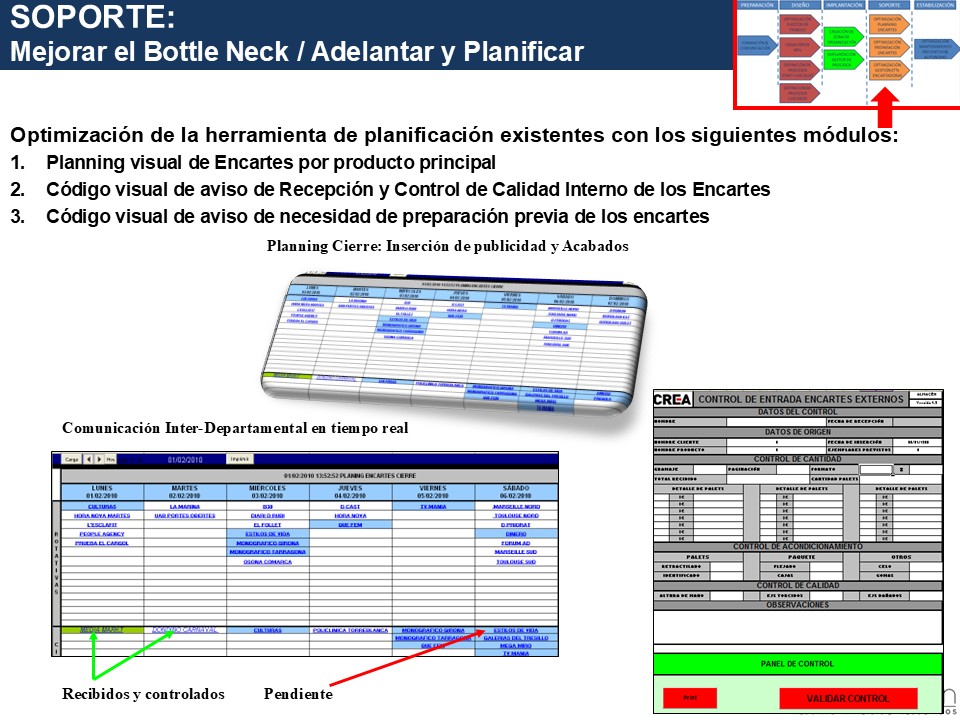
INSTA-PLAN: Pull Flows & Shorter Lead Times
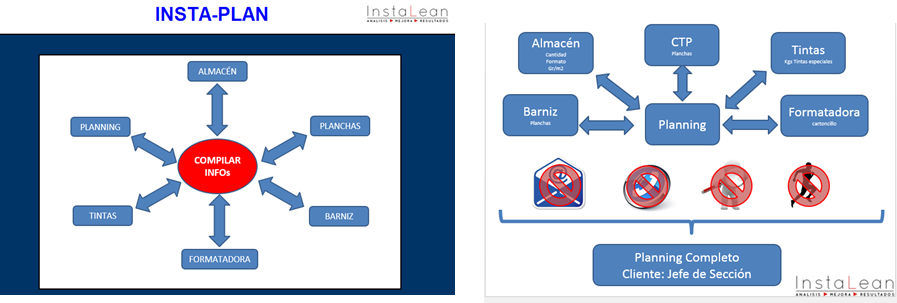
Advantages of Insta-Plan:
- Synchronization of all departments in the same Planning
- Elimination of administrative work
- Evolution of real-time planning
- Reduction of Over-production & Pull Flow throughout the company
- Reduction of Changeover Times & Start-up Losses through a Sequencing Module
- Freeing up resources to perform other tasks –
Insta-Plan Visual Planning Example: Production manager terminal
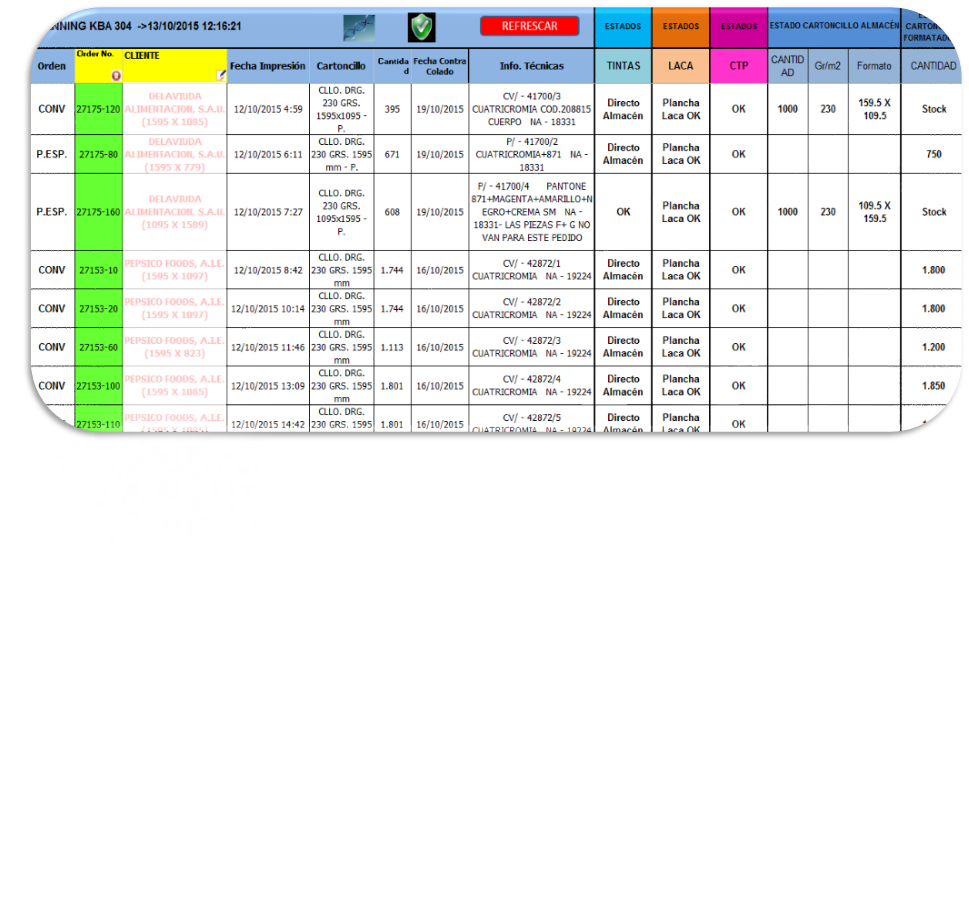
Terminal Manager of Production:
- Green light system when all raw materials are available within the production unit
- Scheduling algorithm respecting the performance of each machine and the weekly maintenance needs
- Visual alerts in case of delays in Planning –
Insta-Plan Visual Planning Example:
Internal provider terminal
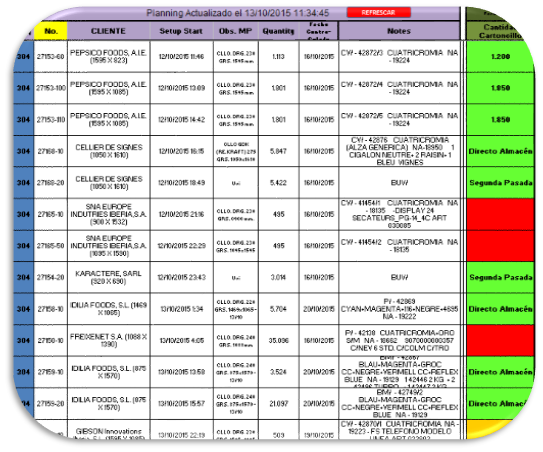
Internal Provider Terminal View:
- Visual alert system in case of danger during machine entry time
- Real-time production monitoring –
Comprehensive planning and unique management
The Planning management It is vital in the industry to avoid:
- Loss of performance across the entire production system due to lack of materials
- Loss of plant performance due to poor sequencing of manufacturing orders
- Increased waste due to poor sequencing of manufacturing orders
In addition to these economic impacts, it is obvious that good planning management improves our service quality and competitiveness through the reliability of our delivery times.
Planning management in offset printing is often an obstacle course full of low-value-added tasks that saturate various company resources, diverting them from their main functions:
- Section Chief (15%->50% of time)
- Warehouse (10%-30% of time)
- Plant Coordinator (5->10% of time)
- Support Department: (FTP/ Inks / Formatting Machine / Varnish/etc…) (5%->10% of time)
Graphic Arts Example: Ink codes to reduce changeover times
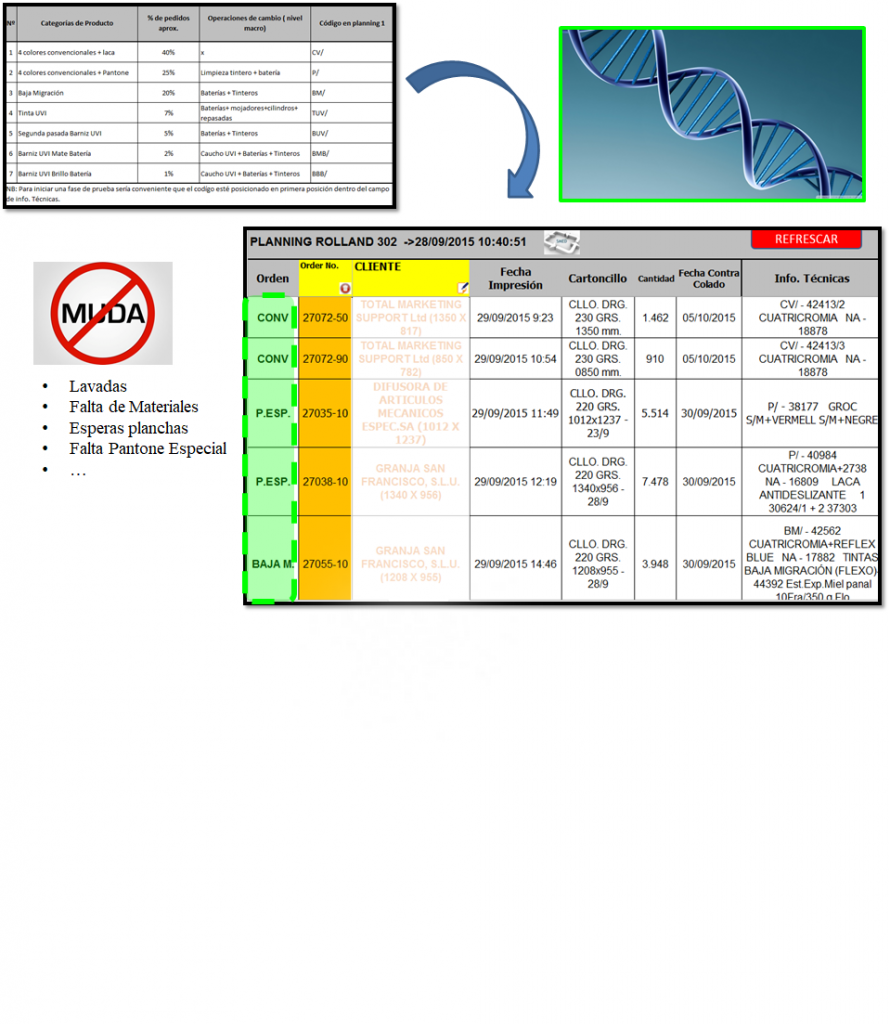
Production System created
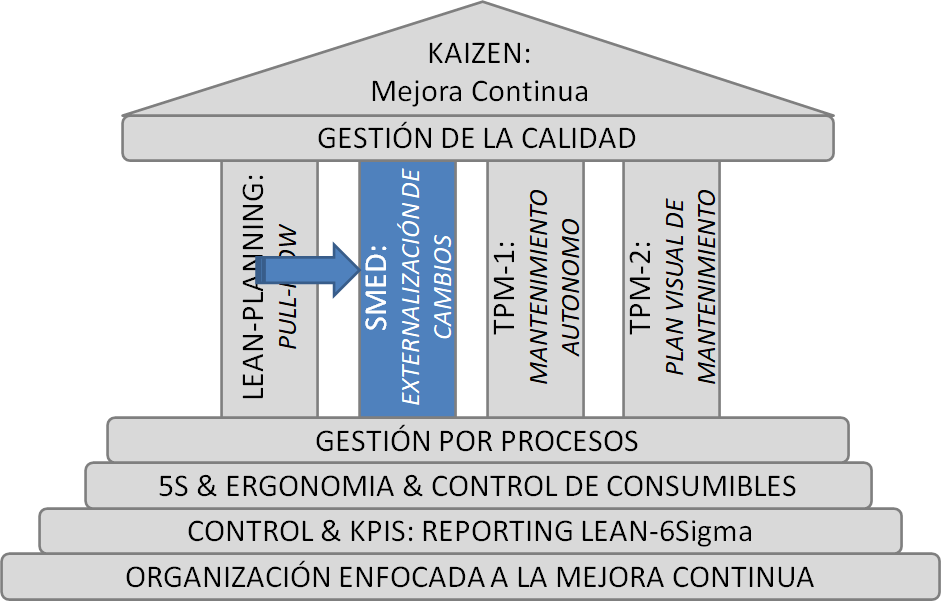
Integrate SMED into the culture
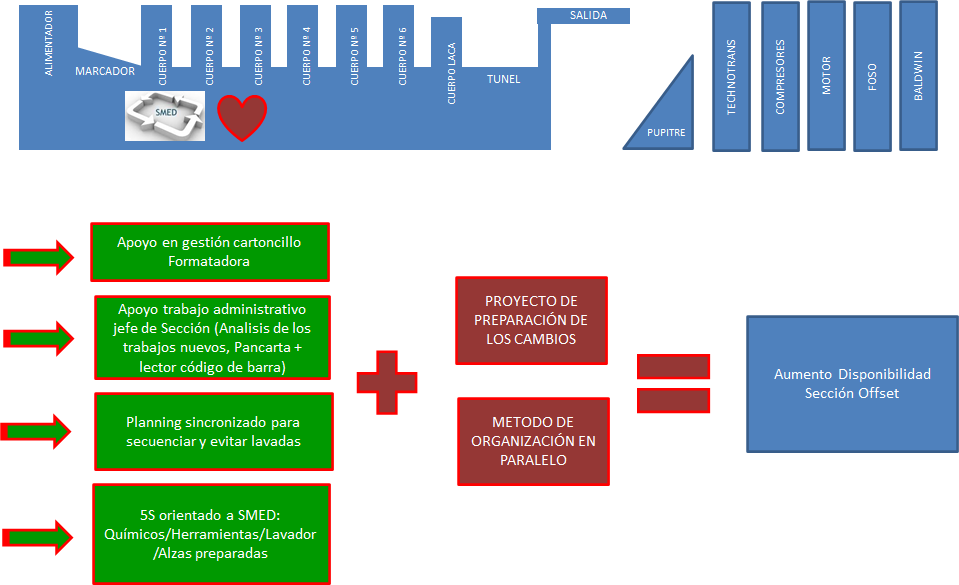
Identifying Downtime Weight Change Families
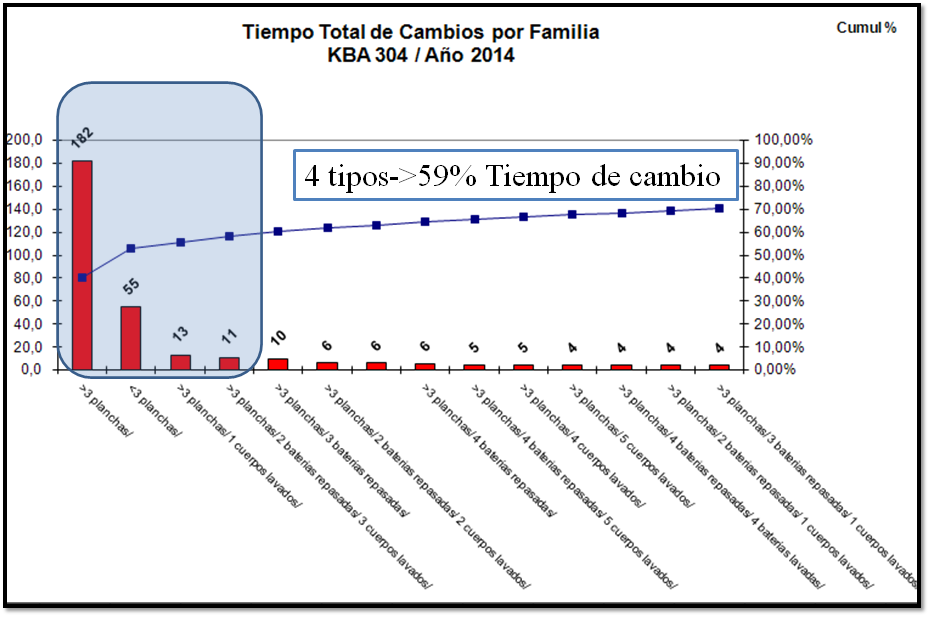
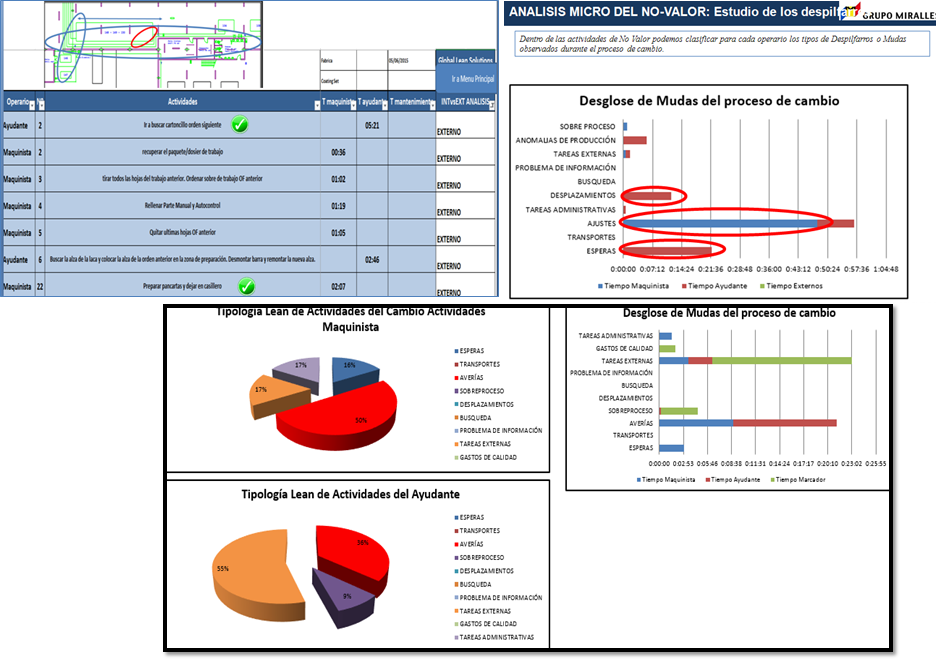
Exchange Rate Analysis
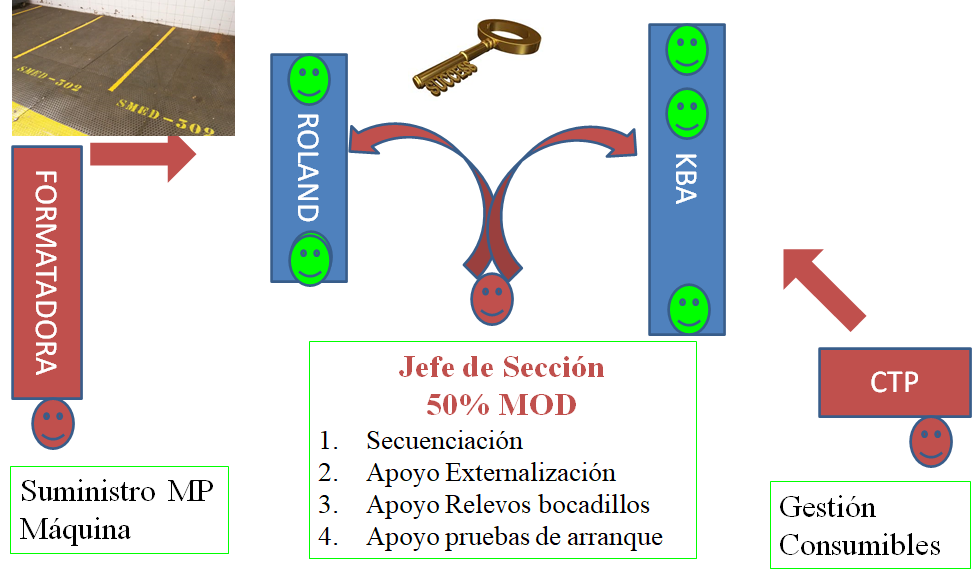
Strategy for improving the added value of personnel
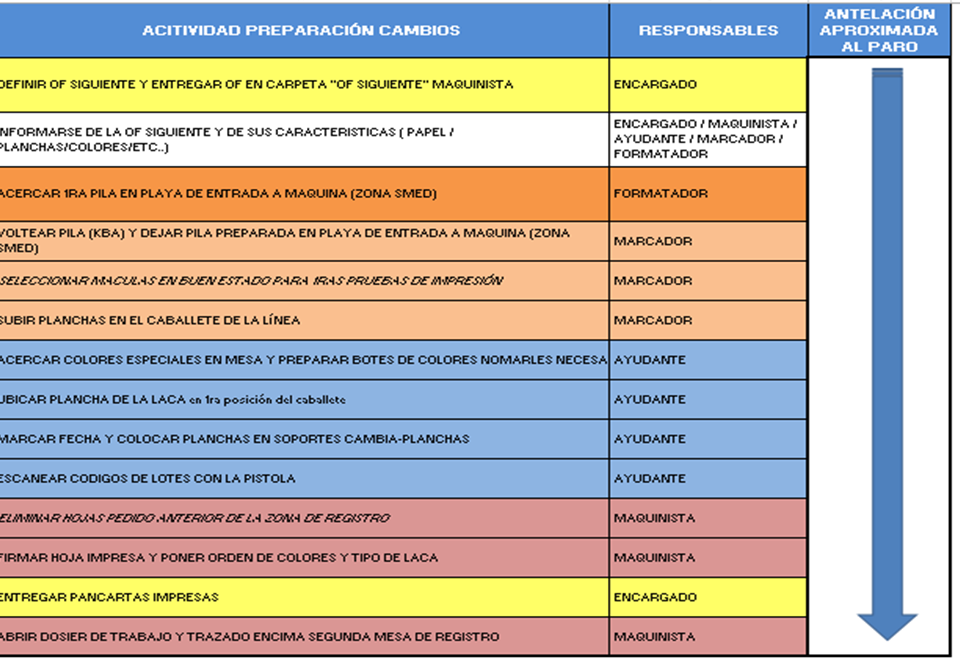
LIST OF TASKS TO PREPARE
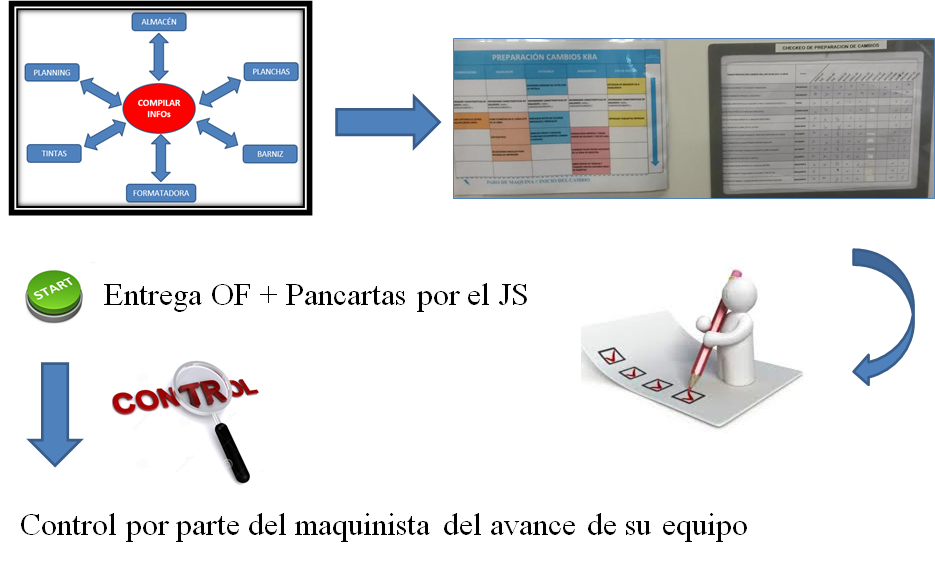
Implementation Control of Change Preparation
Production System created
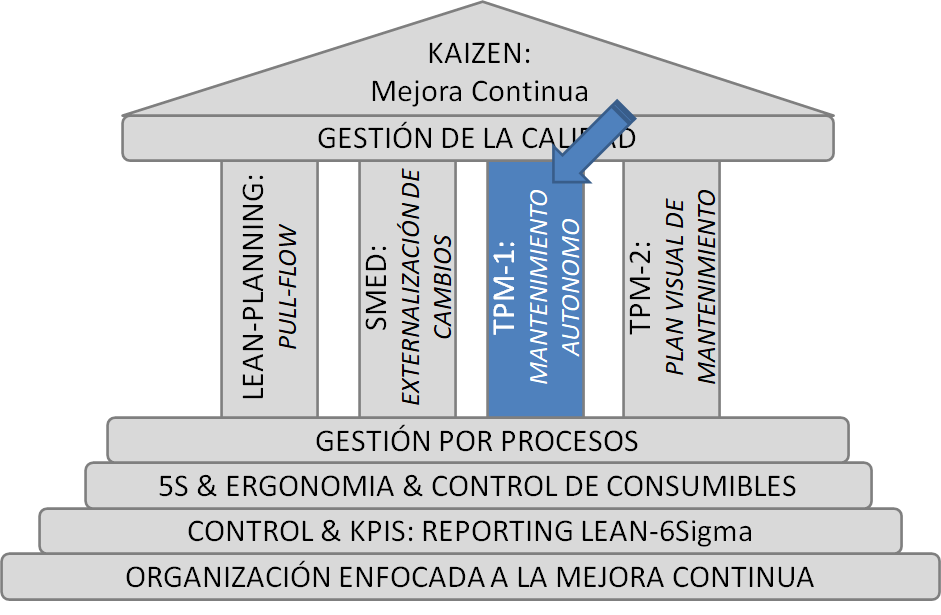
Integrate Continuous Autonomous Maintenance as a culture
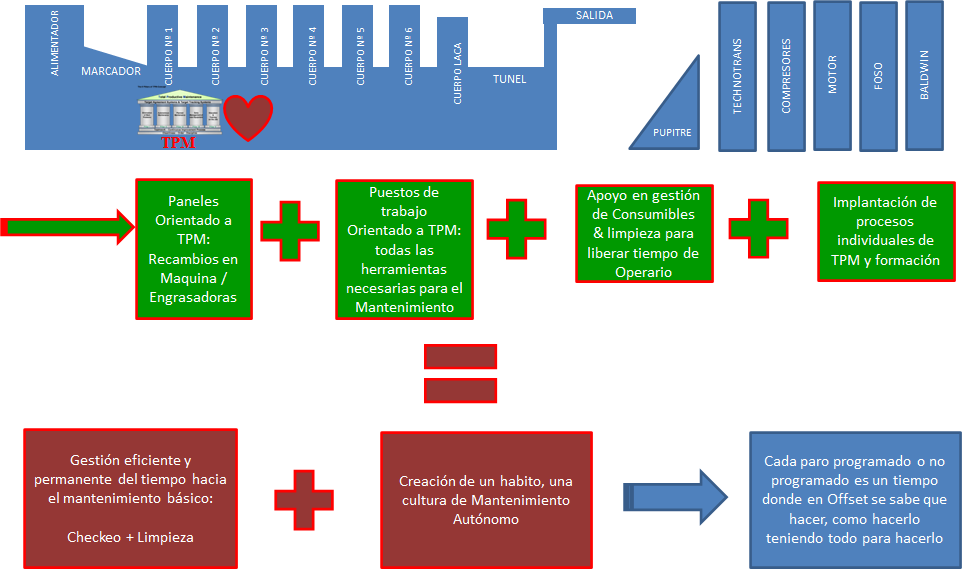
Insta-TPM: Importance of Autonomous Maintenance
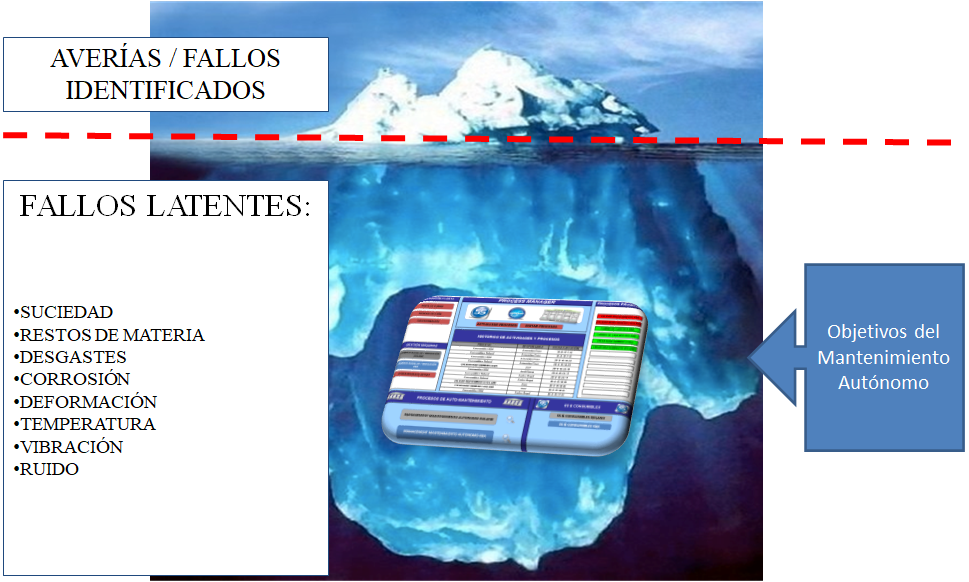
Insta-TPM, a global management tool for Autonomous Maintenance:
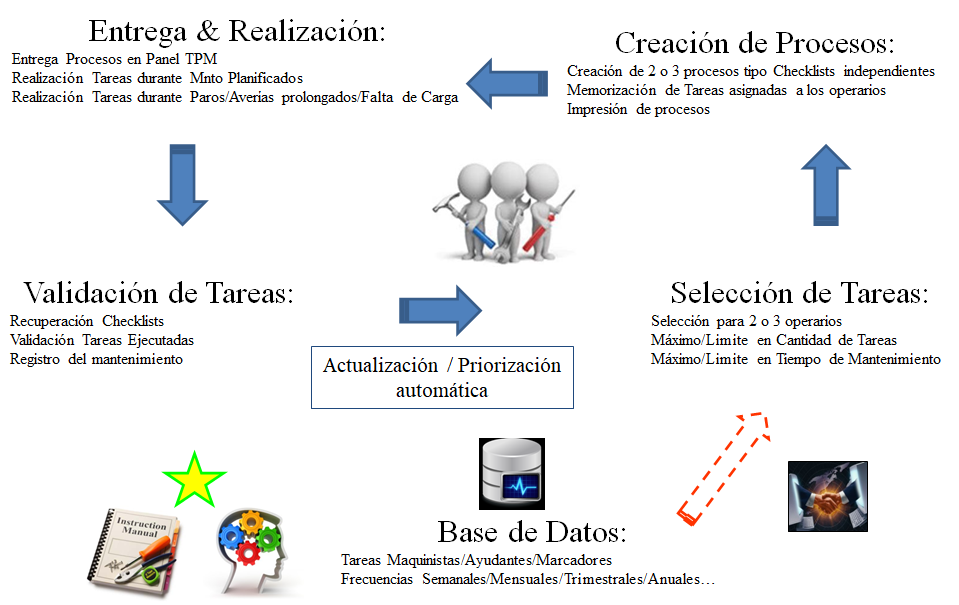
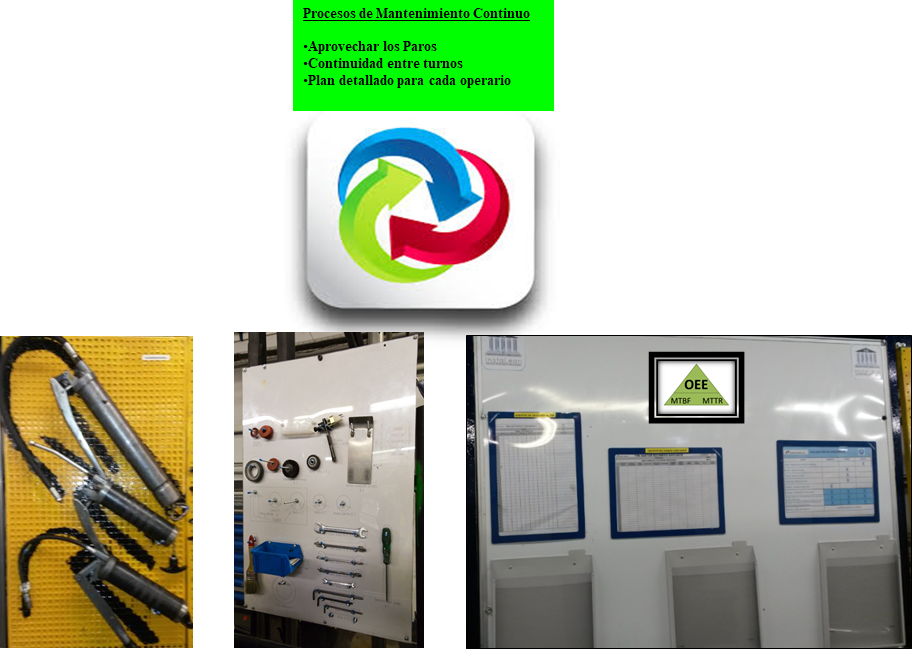
Continuous Autonomous Maintenance
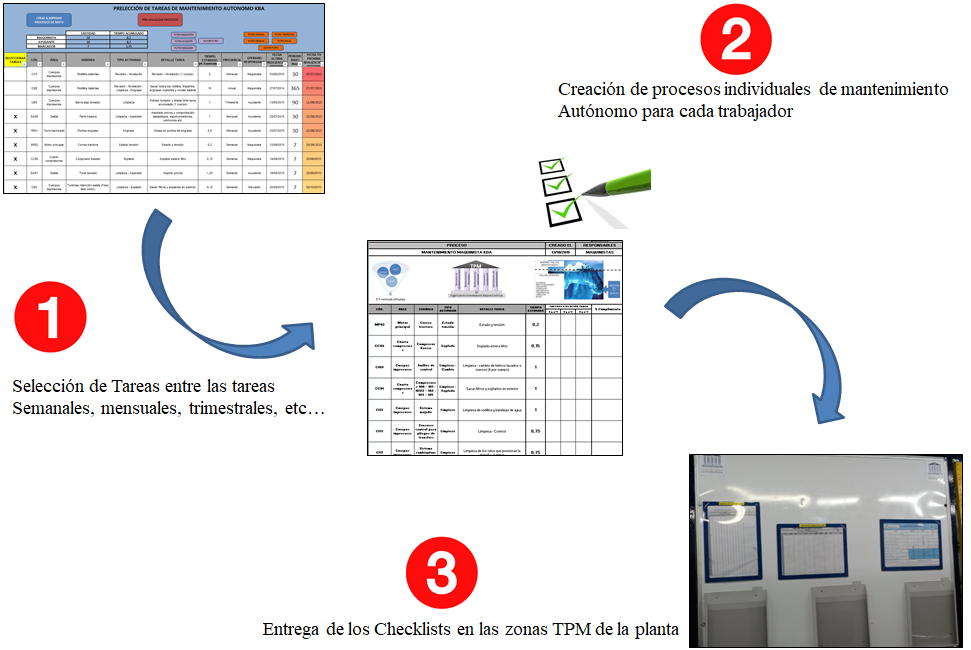
Insta-TPM, an easy and agile tool for selecting and assigning priority autonomous maintenance tasks
Production System created
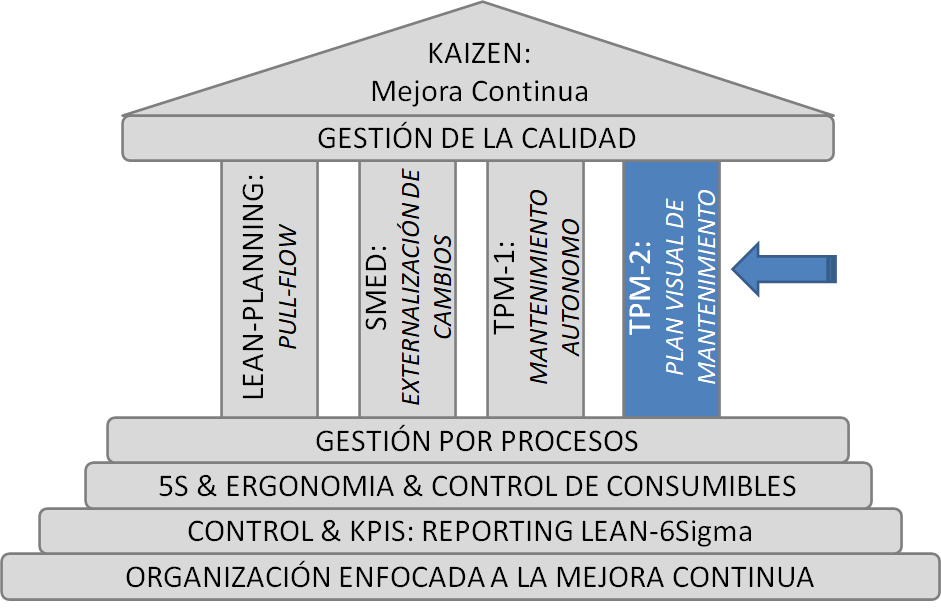
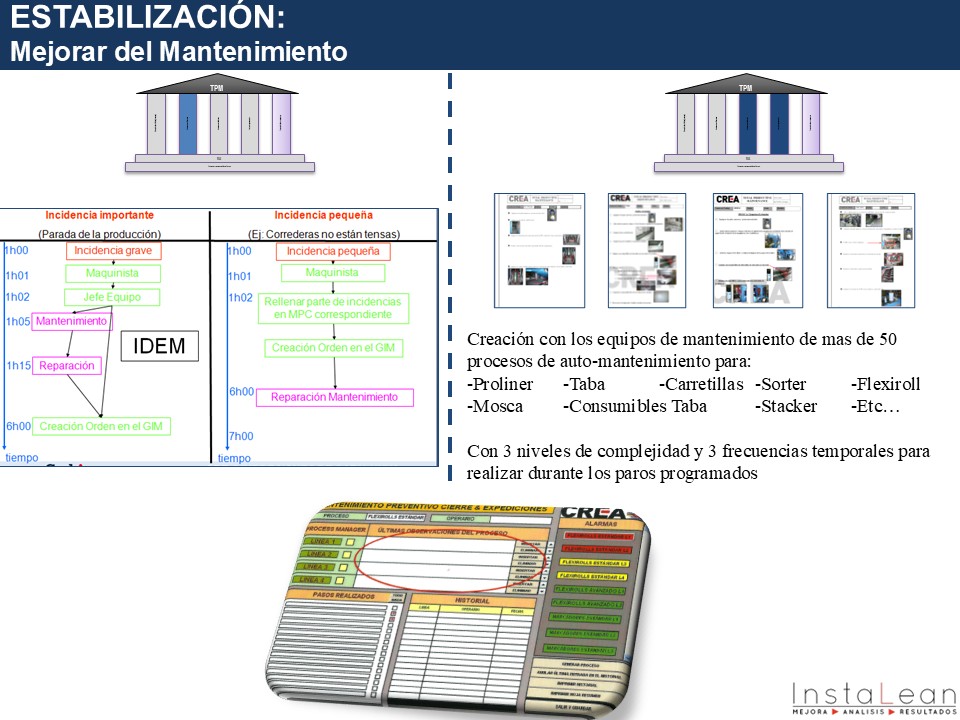
The Visual Maintenance Plan
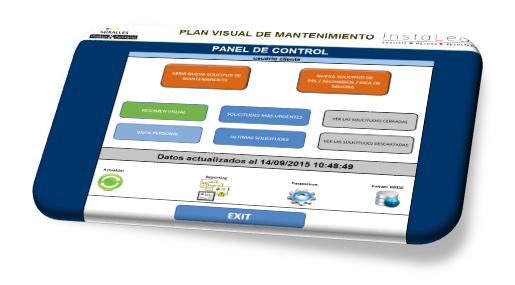
We have created this Maintenance Communication tool with the following objectives:
- Have a Visual Maintenance Plan
- Standardize production diagnostics
- Prioritize requests based on their impact on OEE
- To promote efficient collaboration between Maintenance & Production
- Controlling the quality of maintenance service
- Eliminate administrative work and information loss
- Improve Efficiency through Improved Maintenance
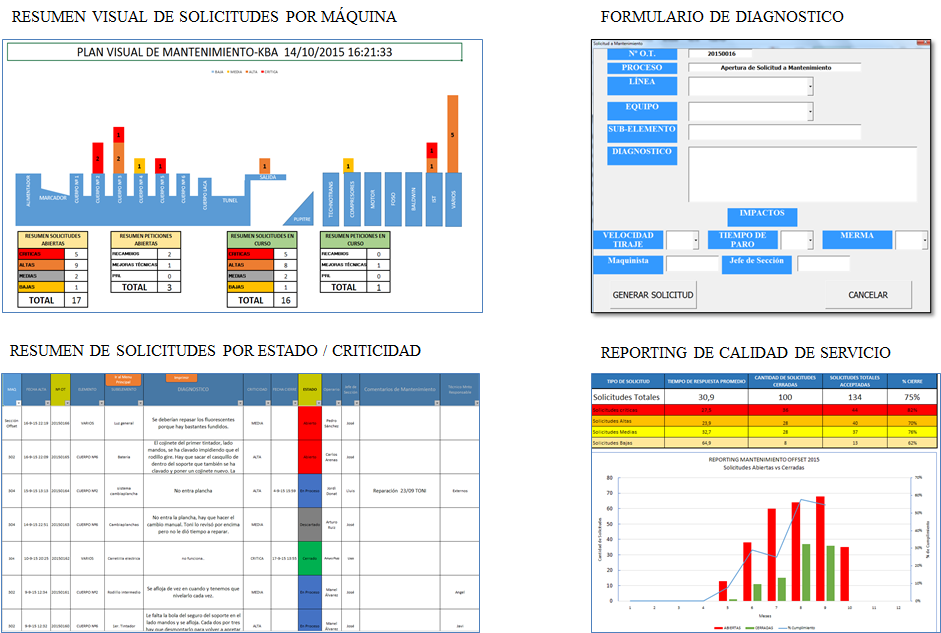
Advantages & Functions of the Visual Maintenance Plan
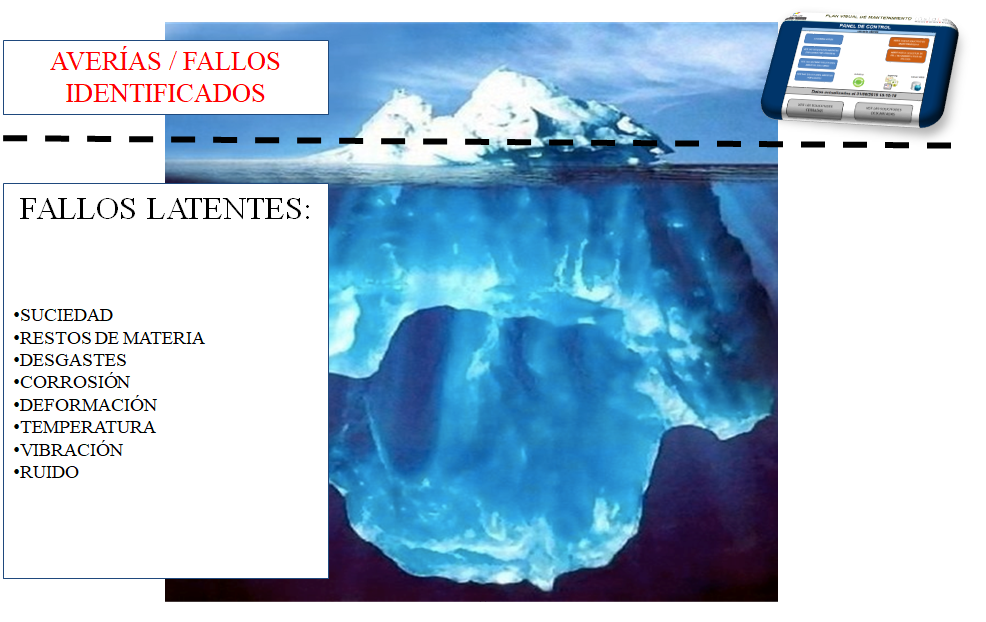
Perfect Maintenance: A Complex & Broad Challenge
Impact Levels of a Maintenance Request
| PARAMETERS | IMPACT LEVEL 0 | IMPACT LEVEL 1 | IMPACT LEVEL 2 | LEVEL OF IMPACT 3 |
| SPEED | It doesn't influence | Micro-stops with mild repercussions and loss of up to 1000 units/hour | Micro-stoppages with notable impact and loss of up to 1500 eq./hour | Micro-stoppages with significant repercussions and loss greater than or equal to 1500 ex. / hour Security Risks |
| STRIKES (Account double) | It doesn't influence | Stoppages with minor repercussions and/or losses of up to 5 minutes per change Breakdowns of up to 30 minutes | Strikes with significant impact and loss of up to 15 minutes per change Breakdowns of up to 45 minutes | Strikes with significant repercussions and losses greater than or equal to 15 minutes per change Breakdowns lasting more than 45 minutes Security Risks |
| DECREASE | It doesn't influence | Disturbances that involve a increased shrinkage of up to 5% the jobs | Disturbances that produce a increased shrinkage of up to 10% the jobs | Disturbances that produce a increase above 15% of the jobs Security Risks |
Current KBA Applications
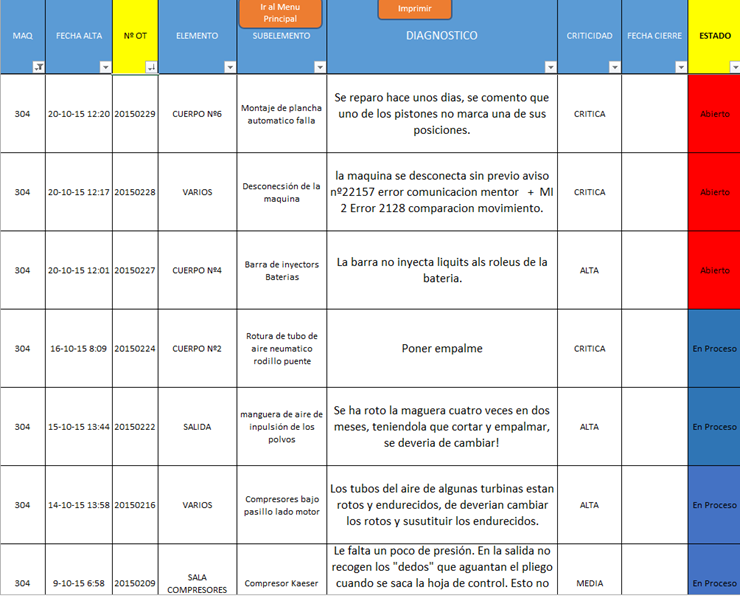
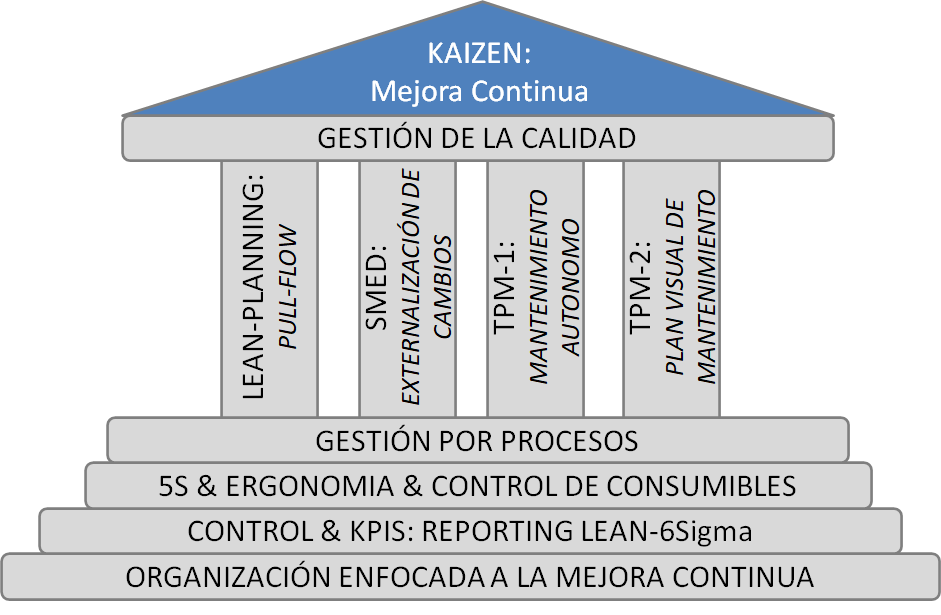
Production System created
AGORA ZONE
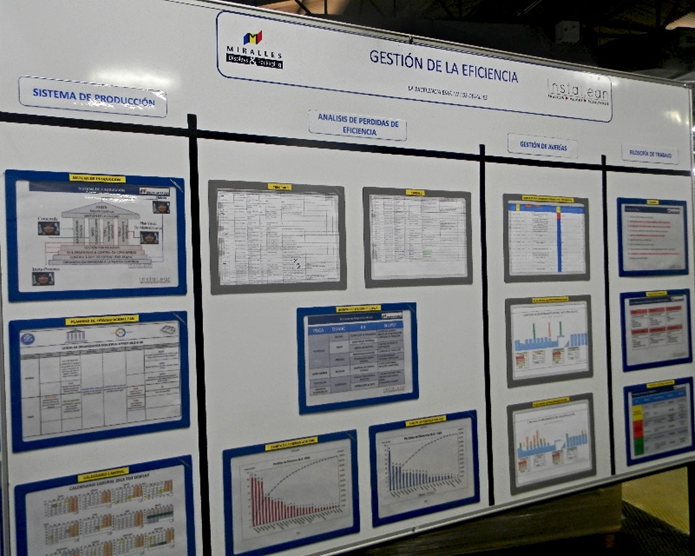
AGORA ZONE: EFFICIENCY MANAGEMENT
EXCELLENCE IS IN THE DETAILS
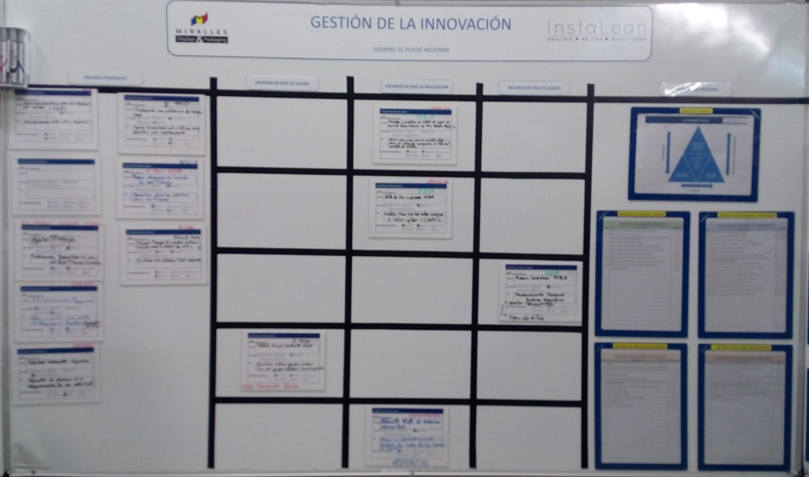
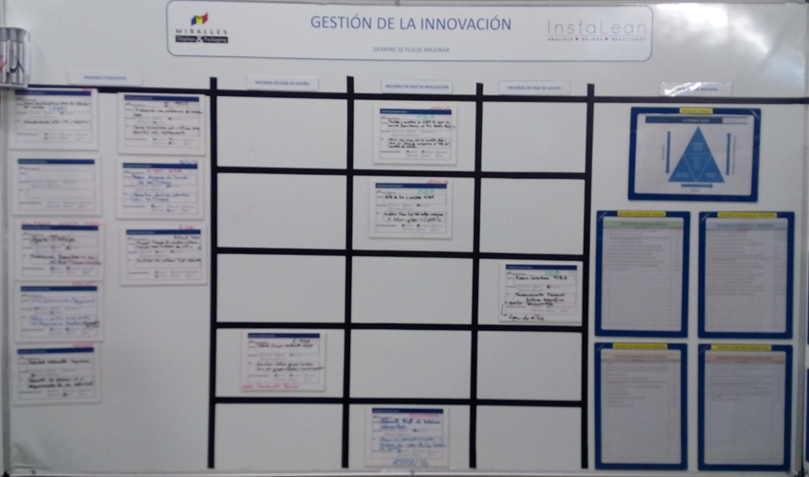
AGORA ZONE: INNOVATION MANAGEMENT
THERE'S ALWAYS ROOM FOR IMPROVEMENT
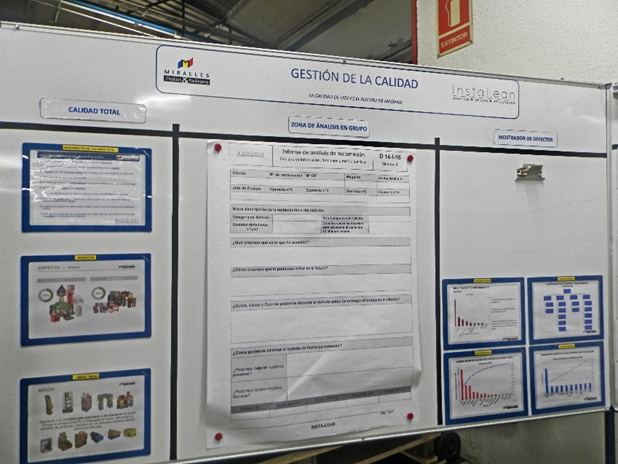
AGORA ZONE: QUALITY MANAGEMENT
TODAY'S QUALITY IS TOMORROW'S FUTURE
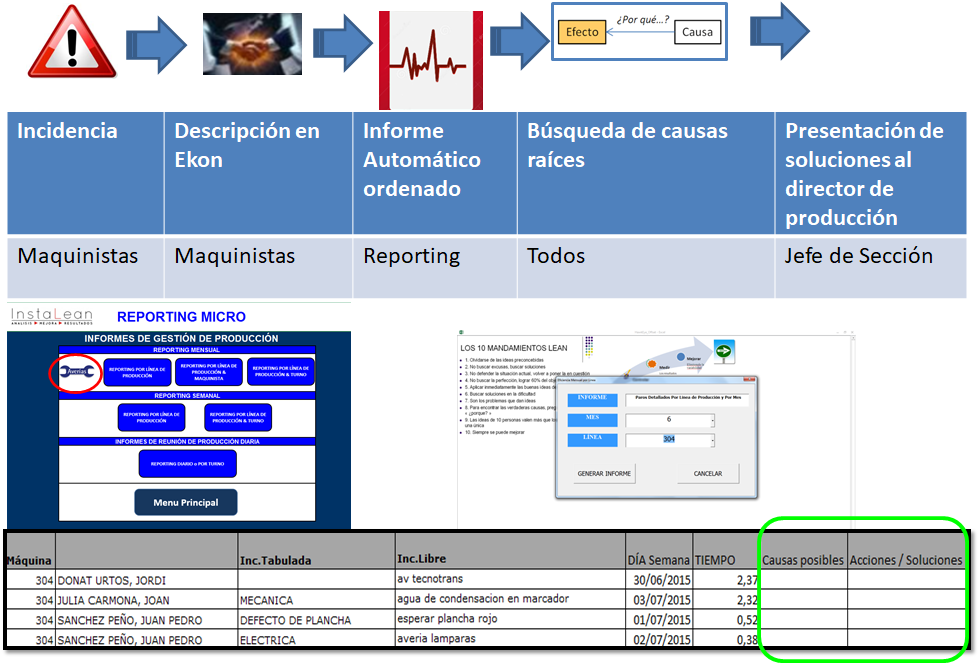
Breakdown Tracking & Extended Downtime
RESULTS

What have we achieved?
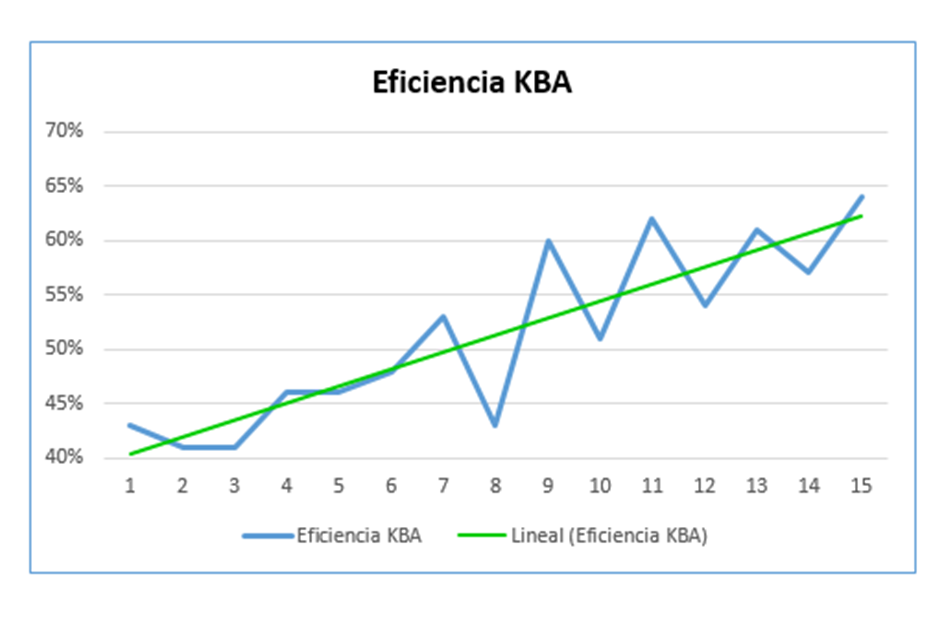
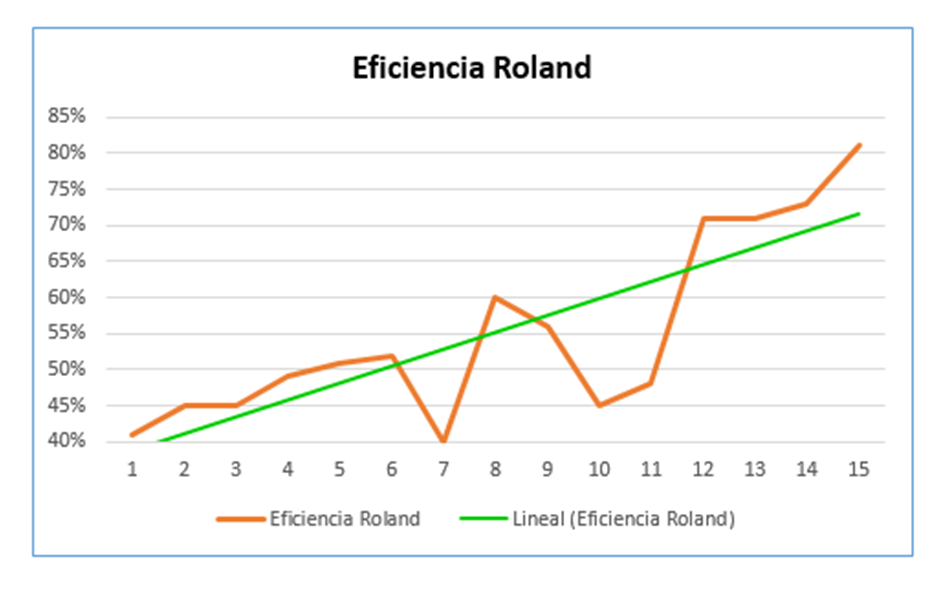
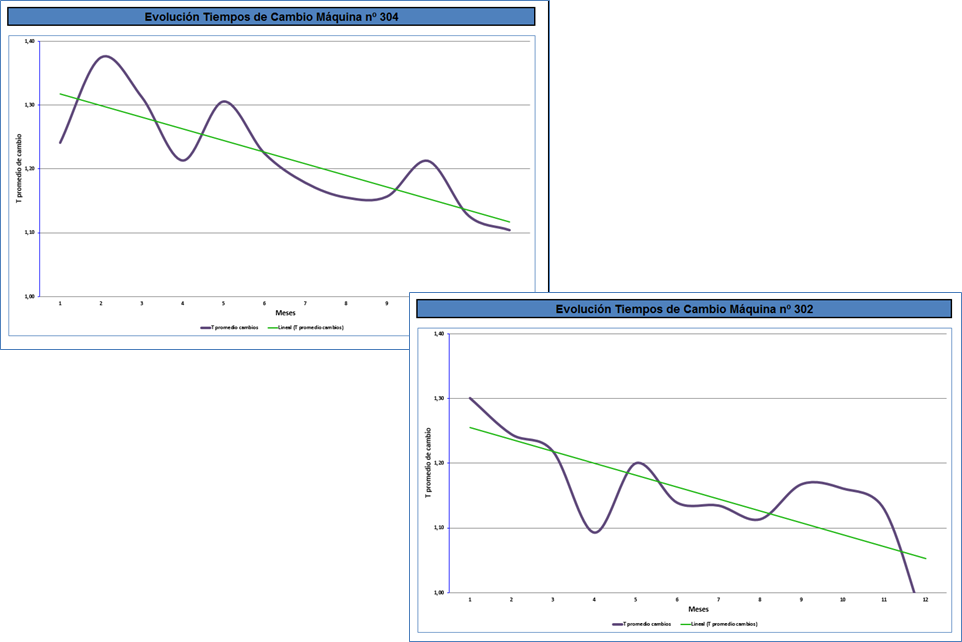
Times of Change: Excellent
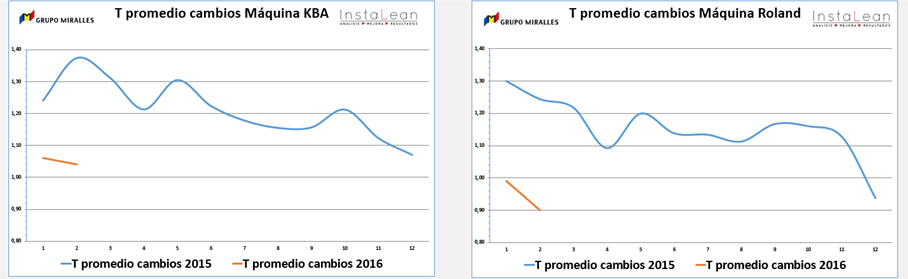
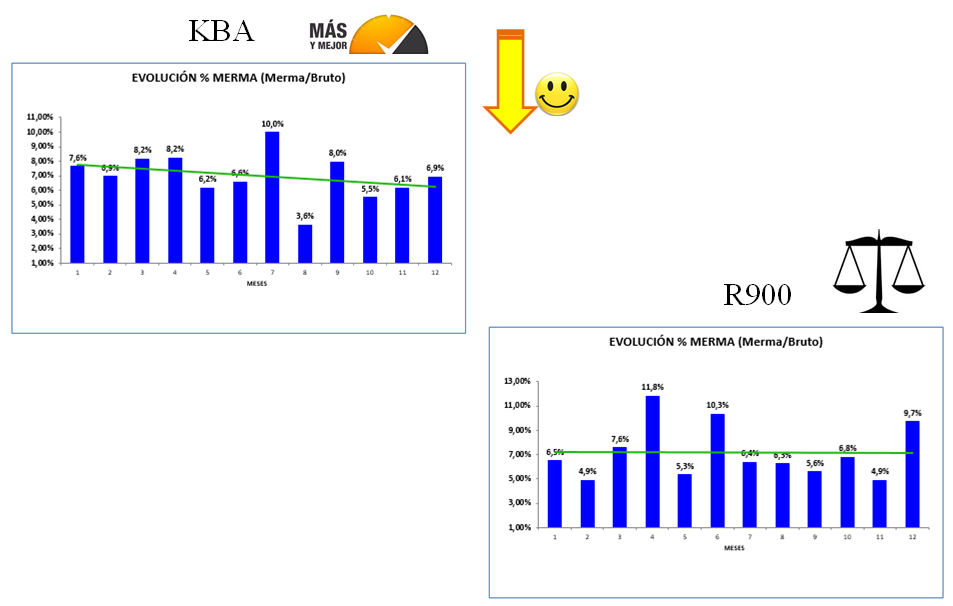
Trend Changes 2015 vs 2016
Evolution Decrease
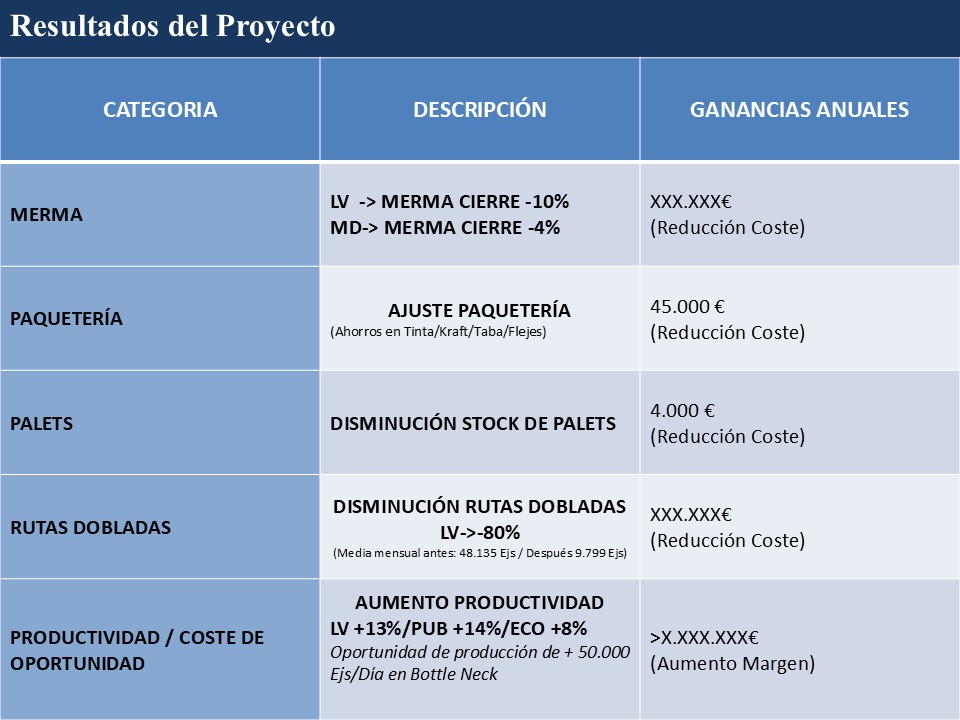
Financial Results
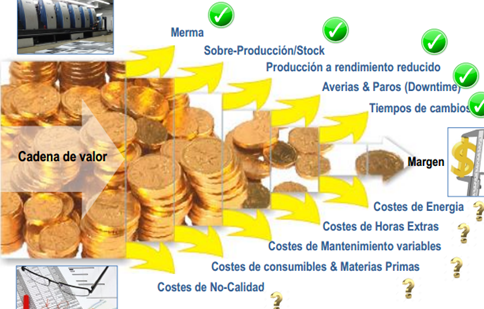
Direct evaluation method (Management Controller)
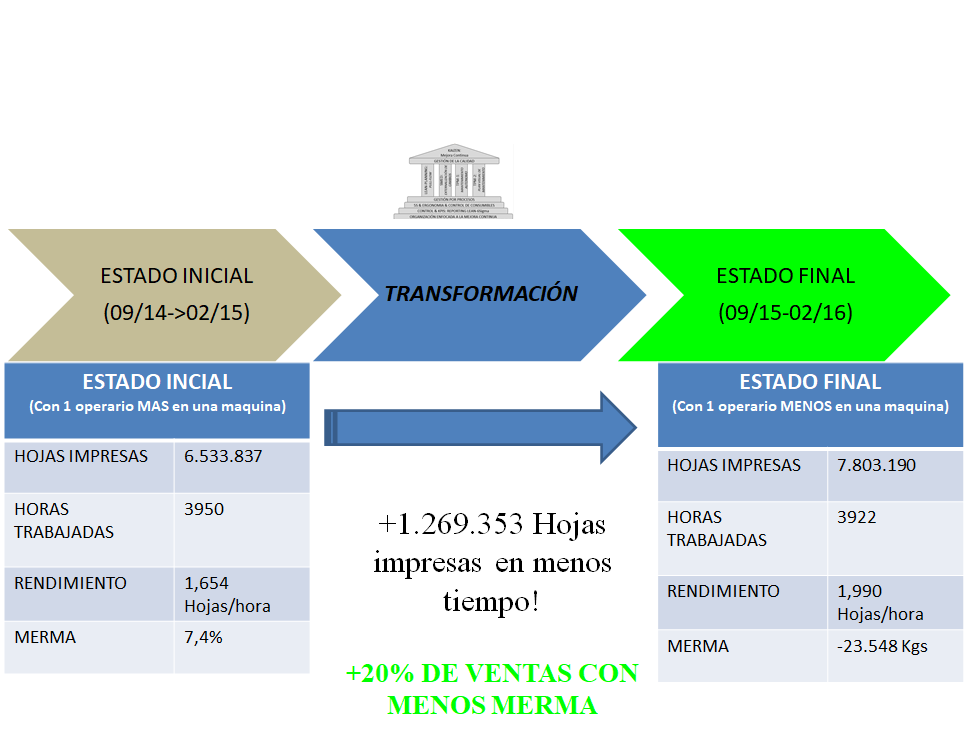
INDUSTRIAL POINT OF VIEW
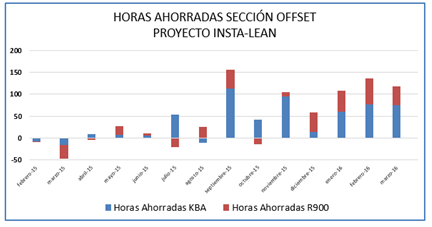
EXTRA HOURS TO SELL….
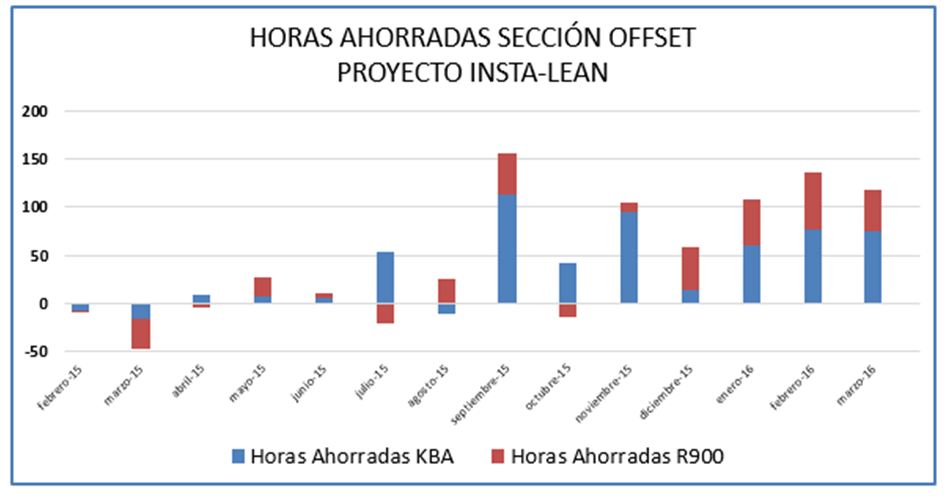
INDUSTRIAL POINT OF VIEW
LESS CARDBOARD TO BUY…
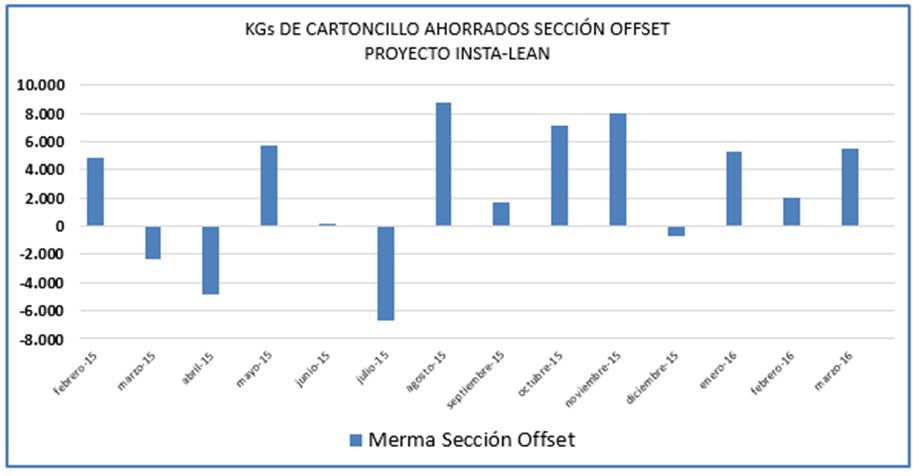
ANNUAL INDUSTRIAL REPORT INSTA-LEAN PROJECT
Offset section only
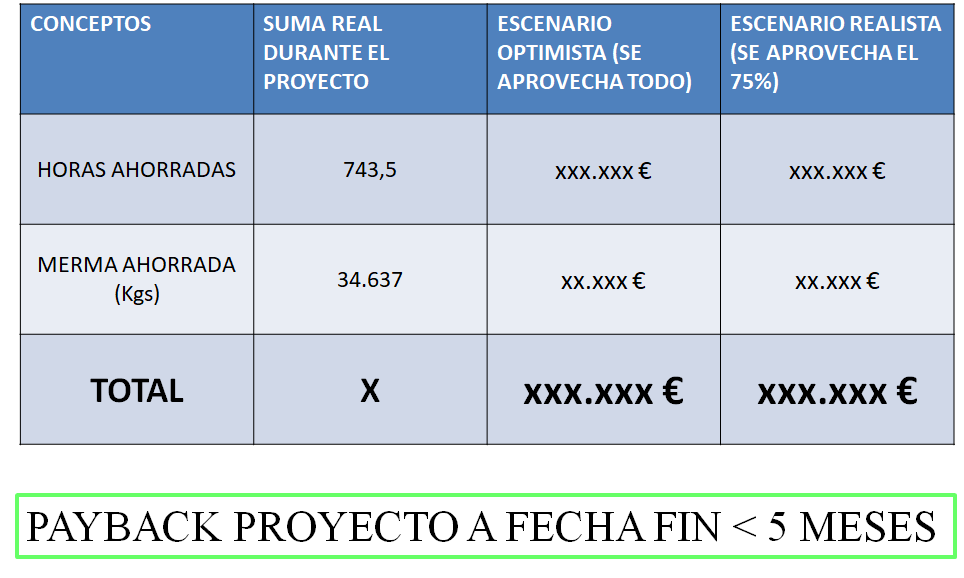
5-year projection
Given the stabilization of results during the last 6 months of the project and that the results of the first 6 months were modest because the project was in the implementation phase, we can estimate that the level of savings in production hours can be maintained without major new efforts in the coming years.
This allows us to make the following projection:
| YEARS | 1 | 2 | 3 | 4 | 5 |
| Accumulated savings optimistic scenario | xxx K€ | xxx K€ | xxx K€ | x.xxx K€ | x.xxx K€ |
| Accumulated savings realistic scenario | xxx K€ | xxx K€ | xxx K€ | xxx K€ | x.xxx K€ |
PRODUCTION SYSTEM AND SOFTWARE
Lean + Industry 4.0 transformation in a family-owned industrial plant
Starting point: Obstacles
Order planning and management
- Lack of order status control
- High level of administrative work
- Manual planning management / lack of synchronization
Efficiency Control
- Lack of efficiency reports
- Absence of lean methods Quality
- Lack of changeover time control
Maintenance
- Corrective-oriented
- Outsourced Management
- Absence of guidelines in the plant
NCIs & Reprocessing
- NCI Lack of Control
- Lack of systematic analysis and resolution
Centralization of Technical Knowledge
- People-centered knowledge
- Few defined/written/digitalized procedures
- Need for a rebalancing of technical knowledge between Operators and Supervisors
Summary of applied improvement levers
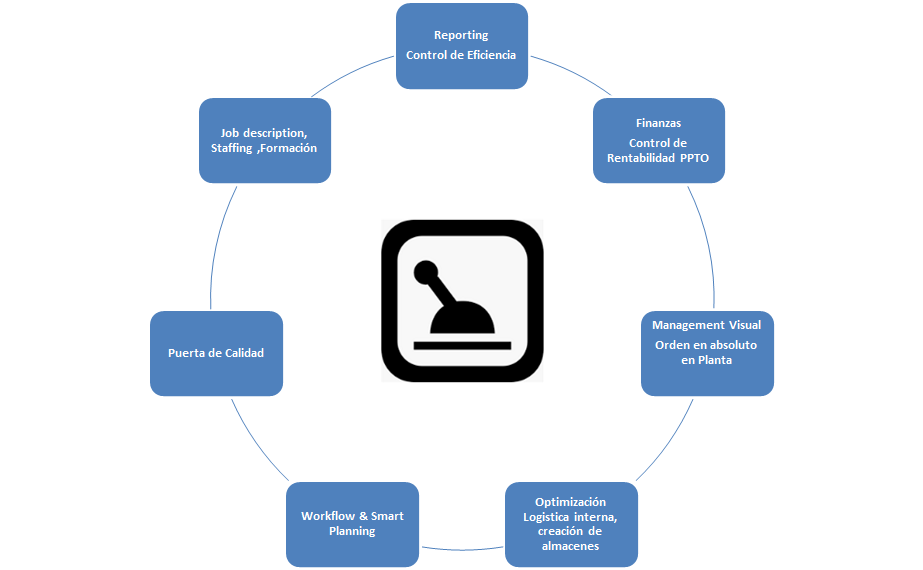
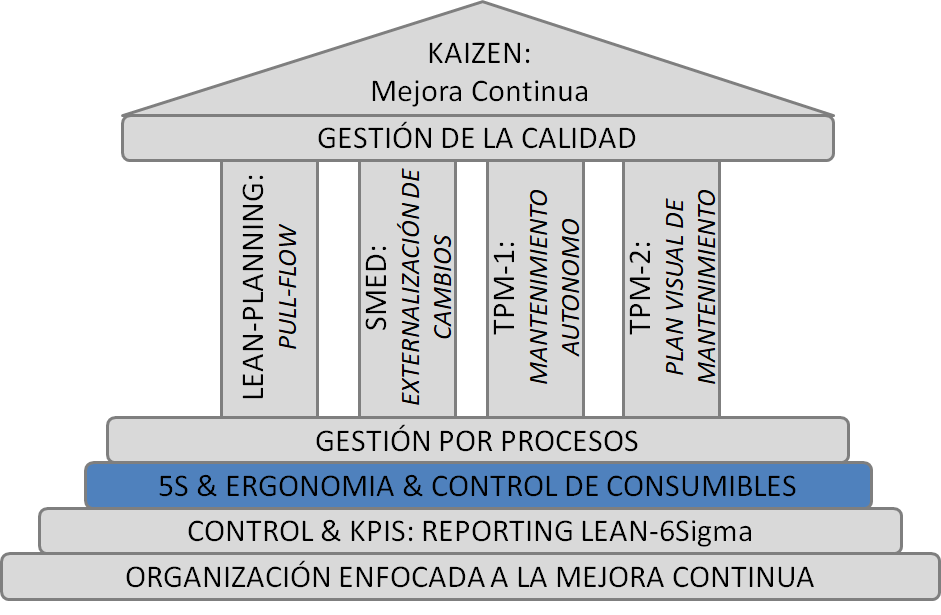
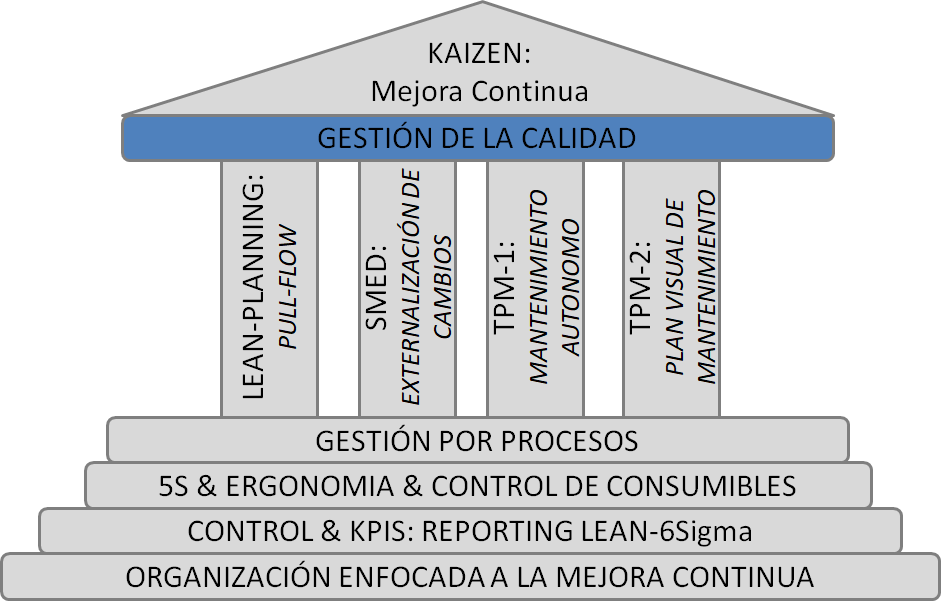
Summary of Production System Created
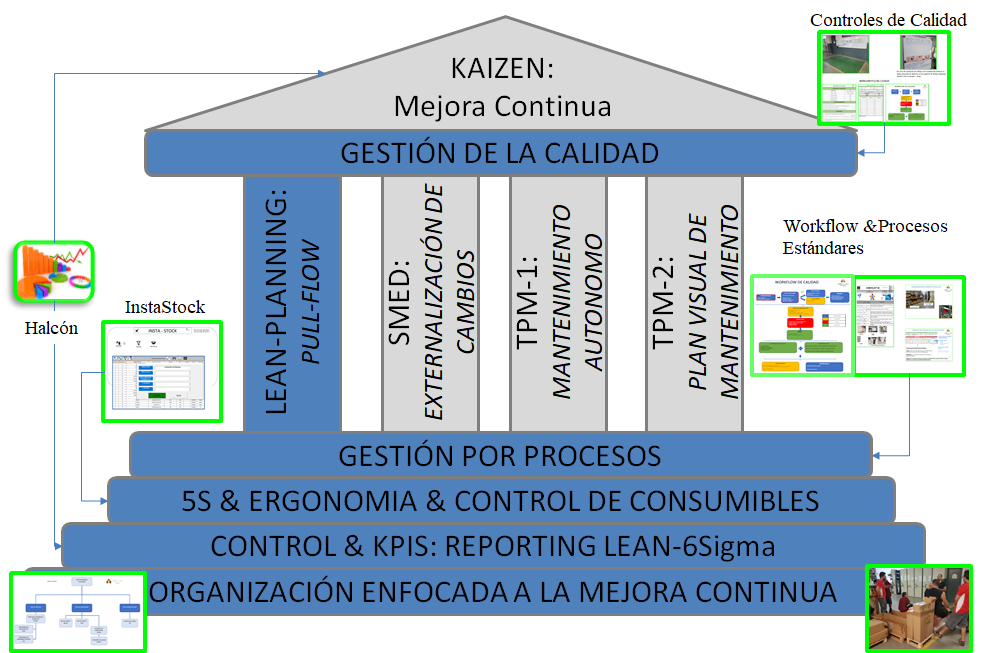
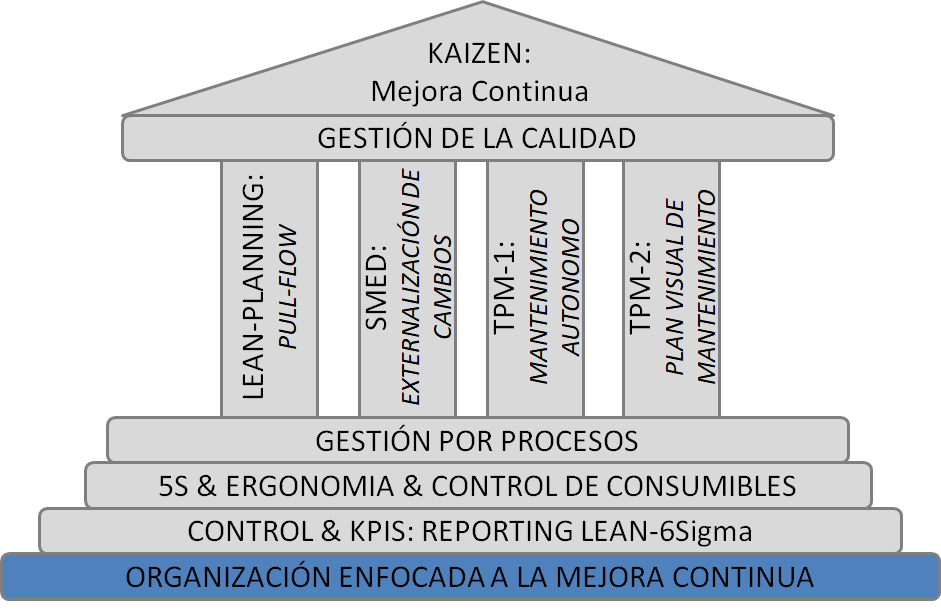
Summary of Production System Created
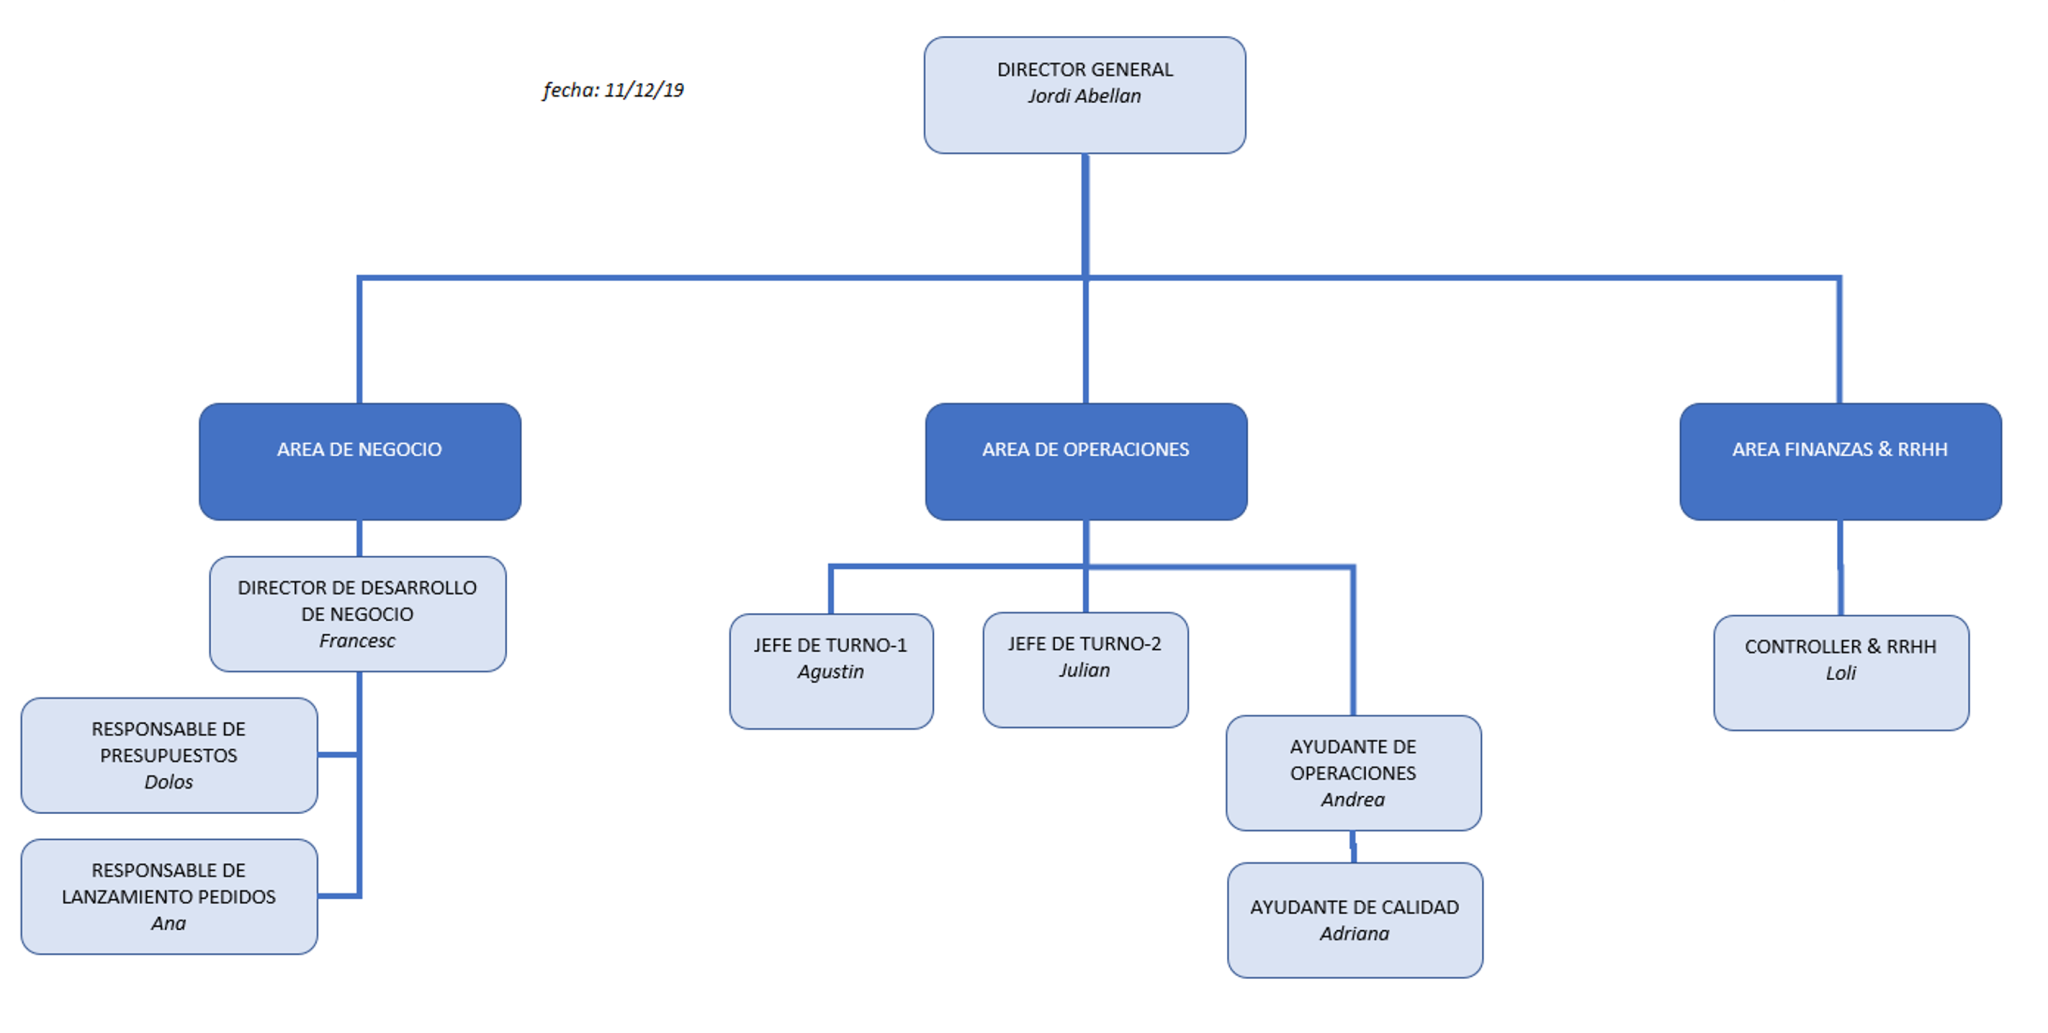
Organizational chart reorganization
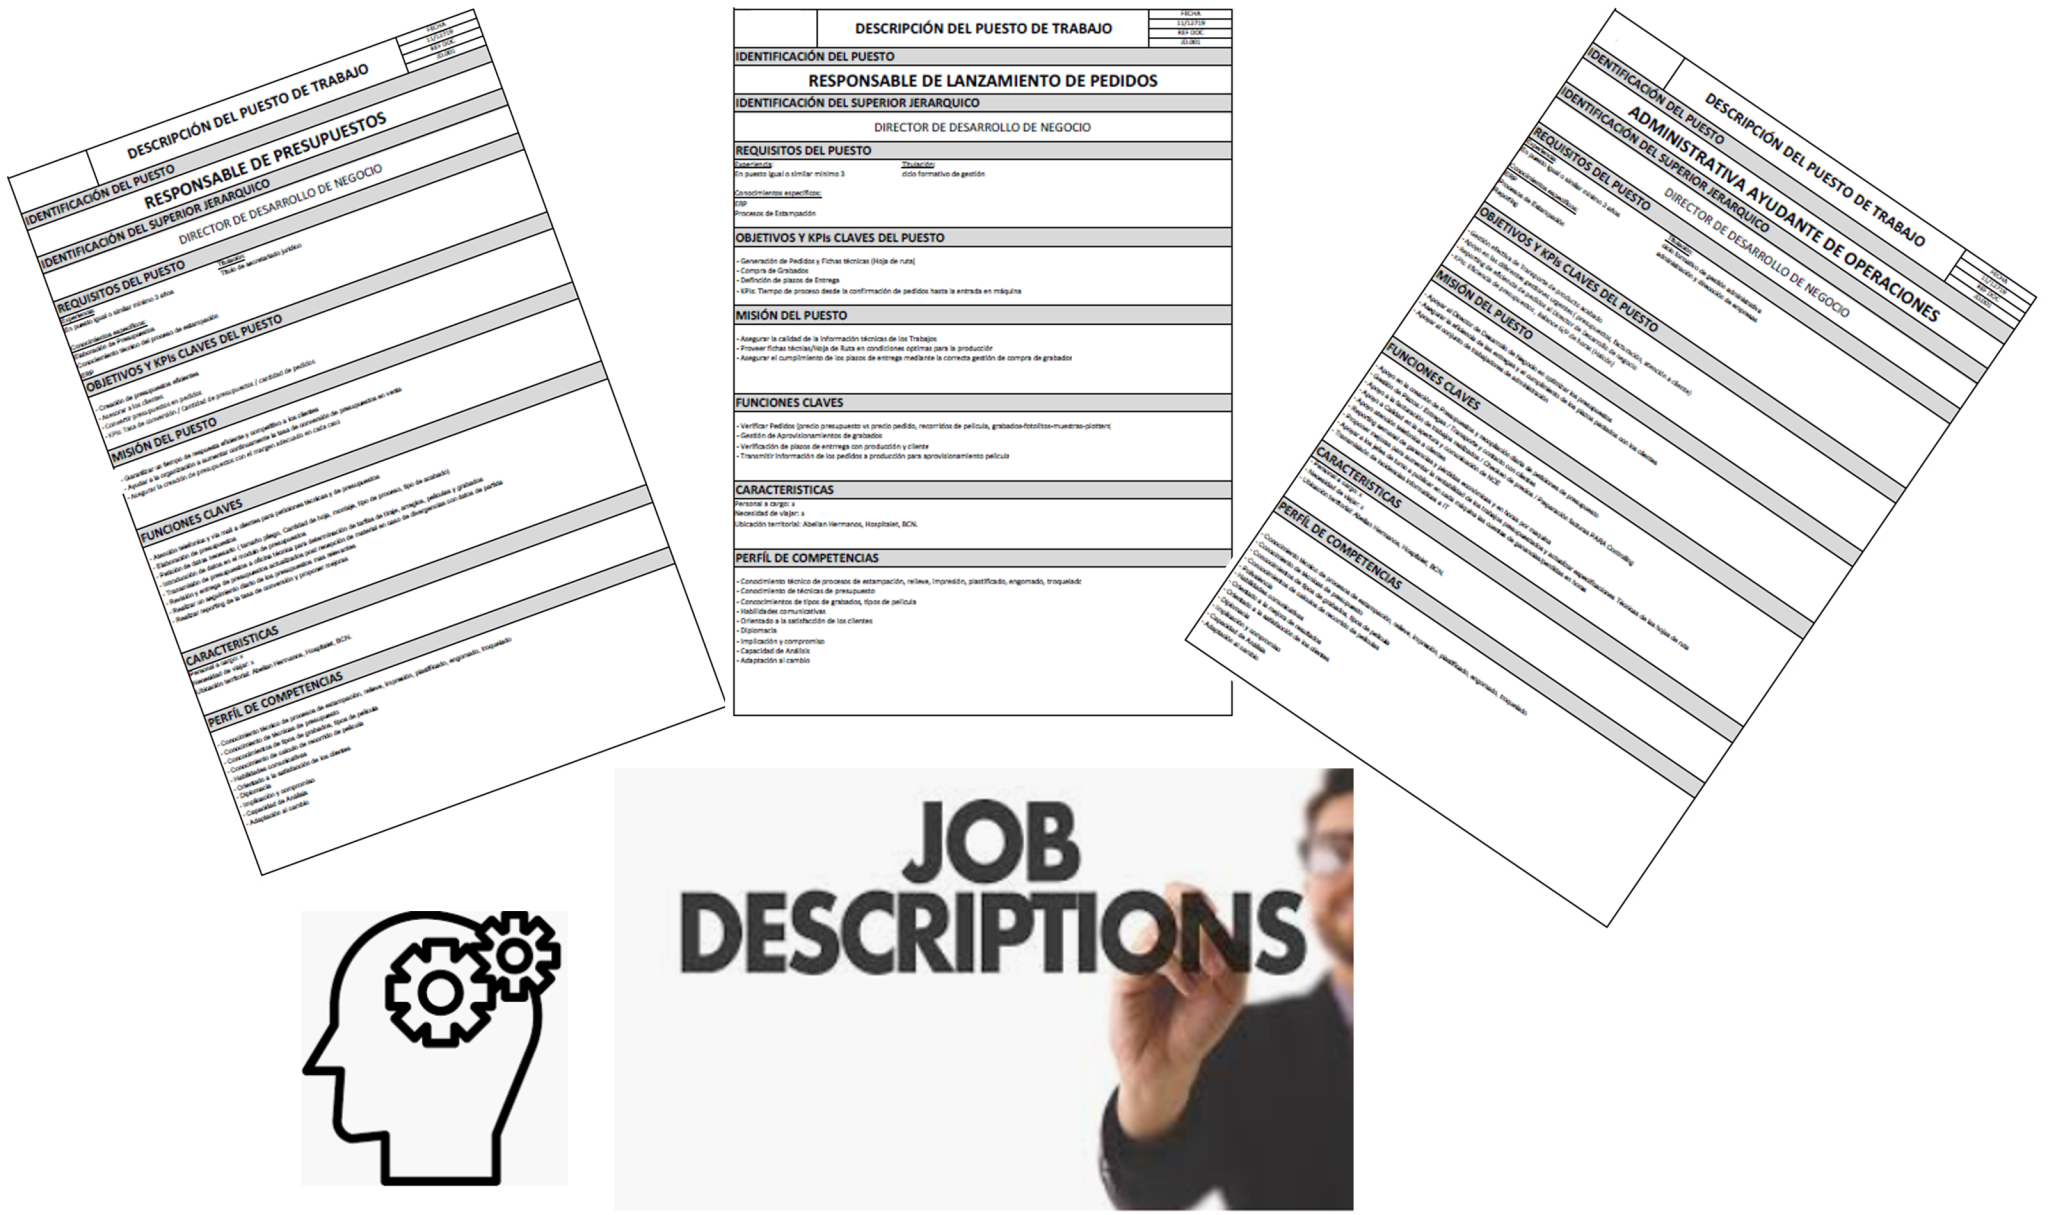
Creating “Job Descriptions” for key positions
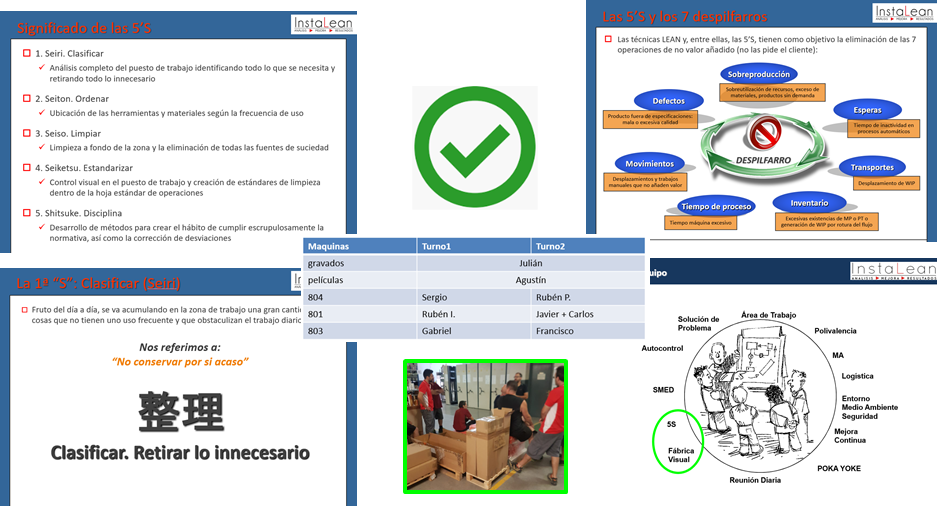
THEORETICAL TRAINING
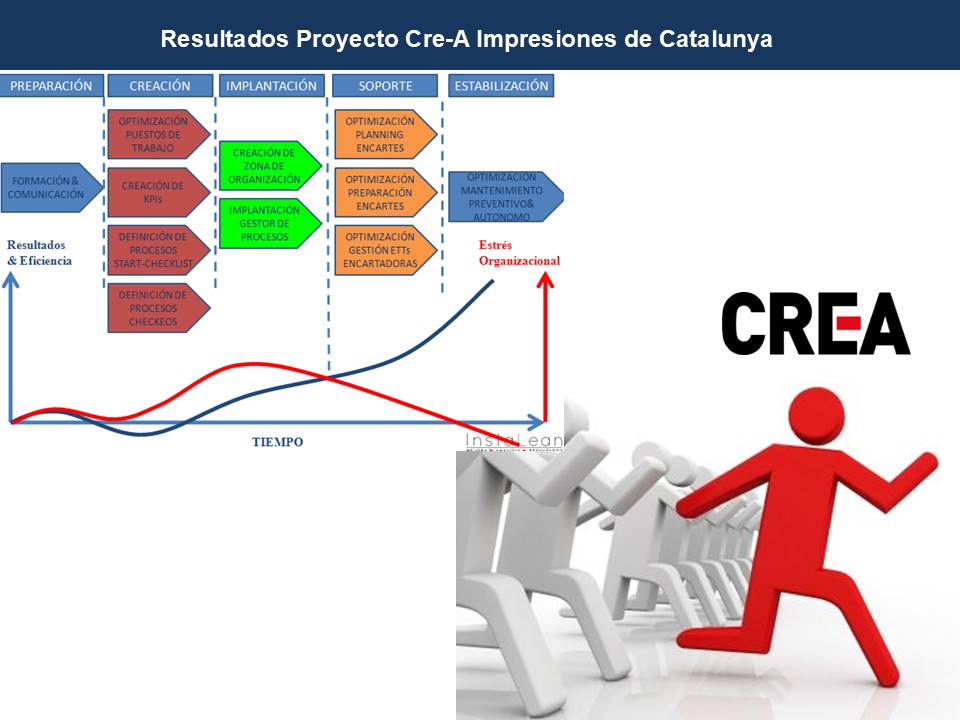
Progress in the discipline and culture of perfection and continuous improvement
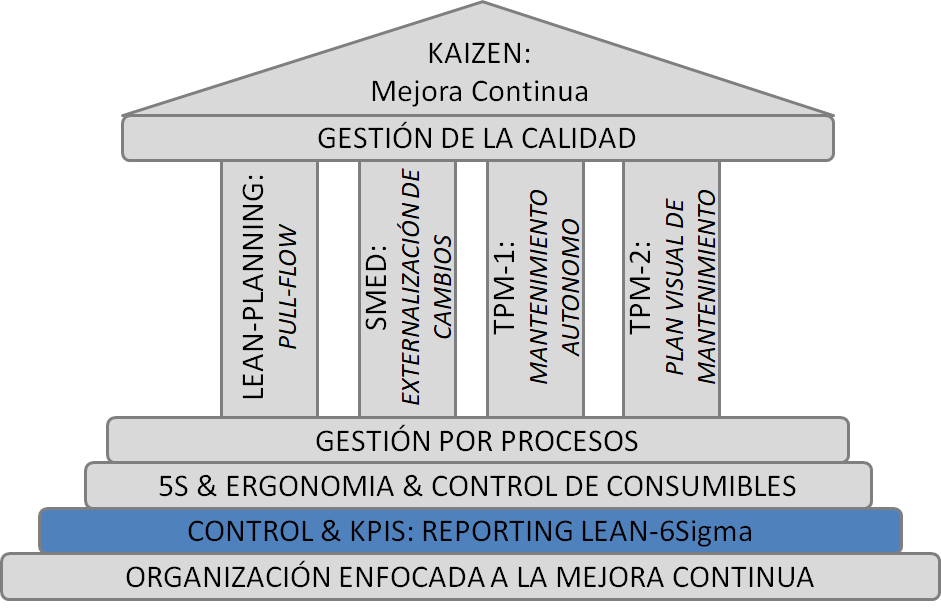
Summary of Production System Created
CONTROL & KPIS: LEAN REPORTING
A tool for focusing on efficiency and profitability results
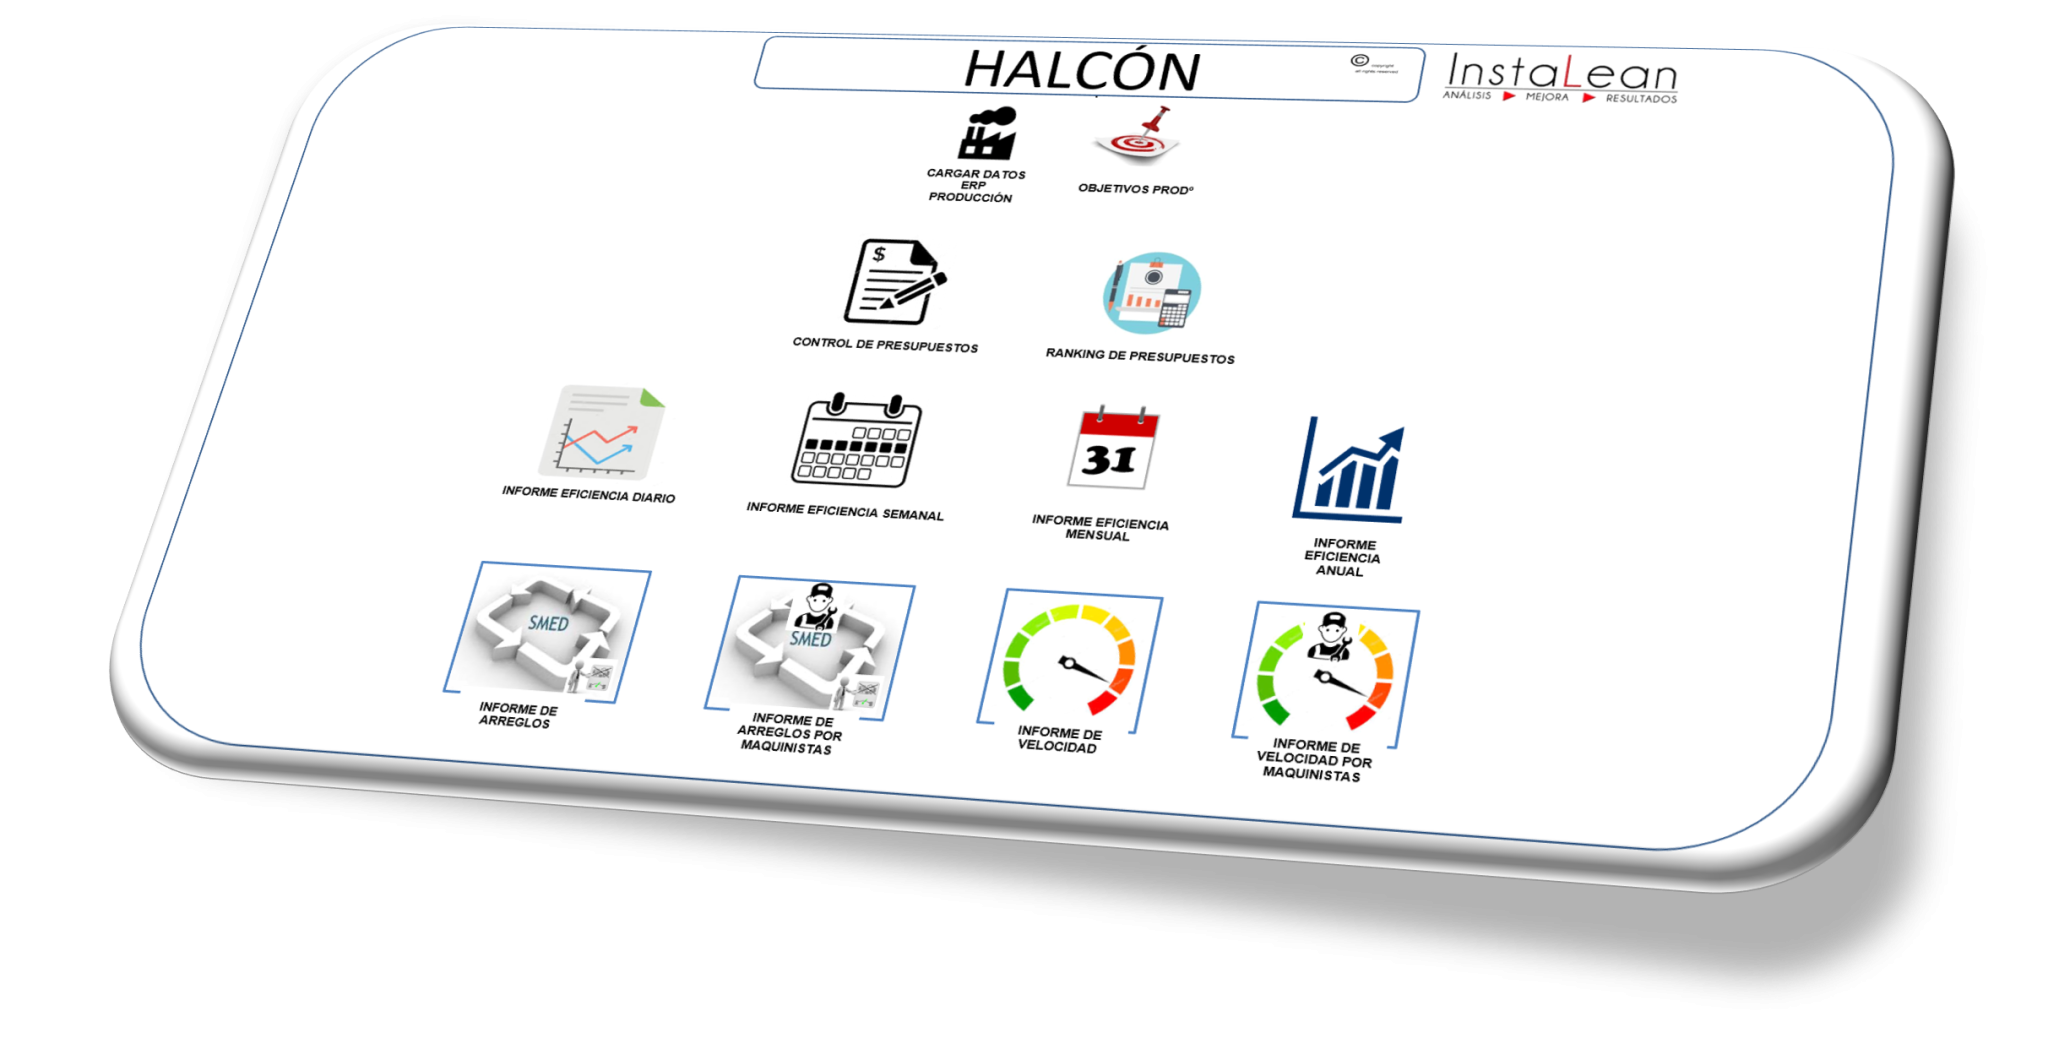
Creation of a Reporting Satellite connected to the ERP allowing:
- Control of gross and net speeds on a daily, weekly, and annual basis, per machine and operator
- Monitoring of repair times at the daily, weekly, and annual levels by machine and operator
- Efficiency and profitability of budgets visible by HR, machine, client, week, month, etc.
Implementations January-February: Management KPIs Module
Profitability ranking by machine and by customer
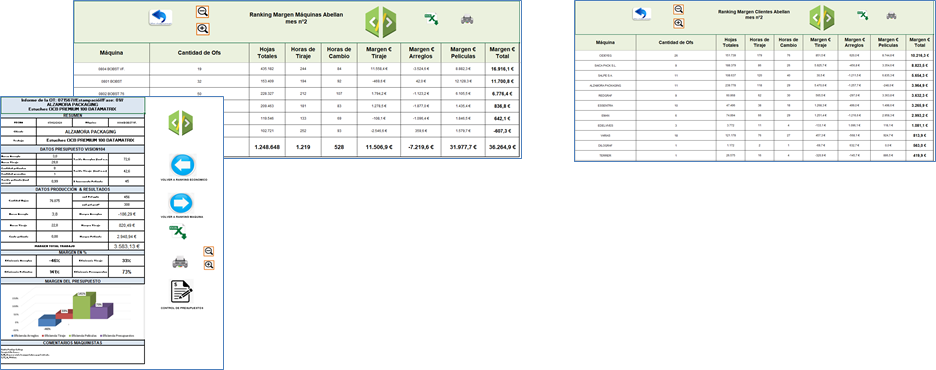
Cross-order profitability report with names and comments on machinist incidents to encourage analysis and continuous improvement
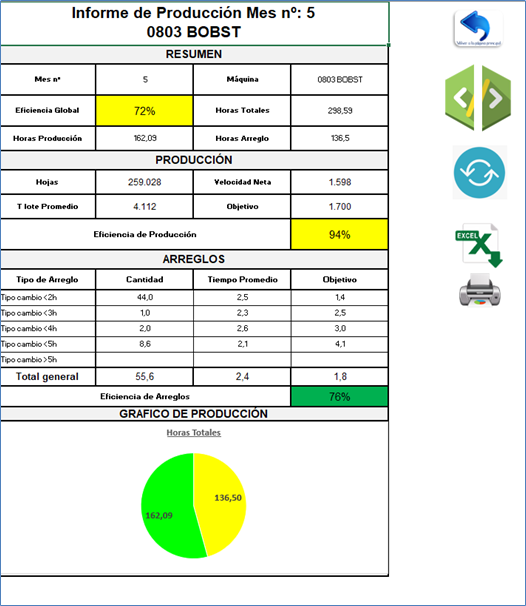
PRODUCTION & SALES EFFICIENCY CONTROL
Control from micro to macro: Machinists, Machines, Orders
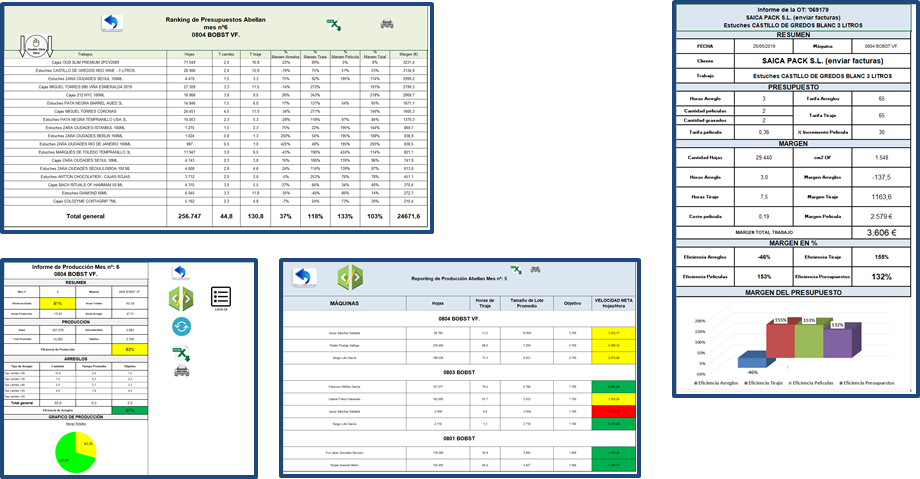
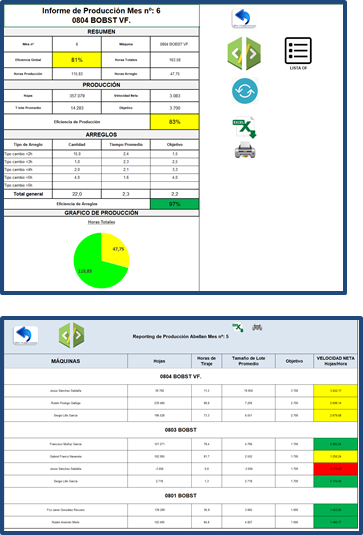
Efficiency monitoring across all timeframes from the monthly level down to the shift-based machinist level
Control sales efficiency and margin of each job
Order Efficiency Control by Machine, Customer, Month, Week, Orders
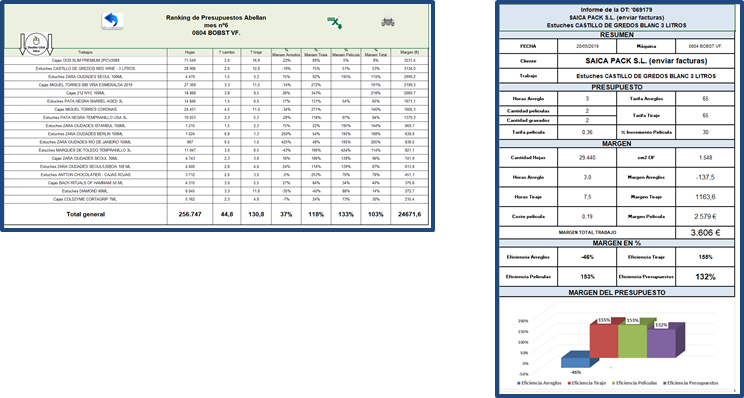
CONTROL & KPIS: LEAN REPORTING
A4 Efficiency Report
Summary of Production System Created
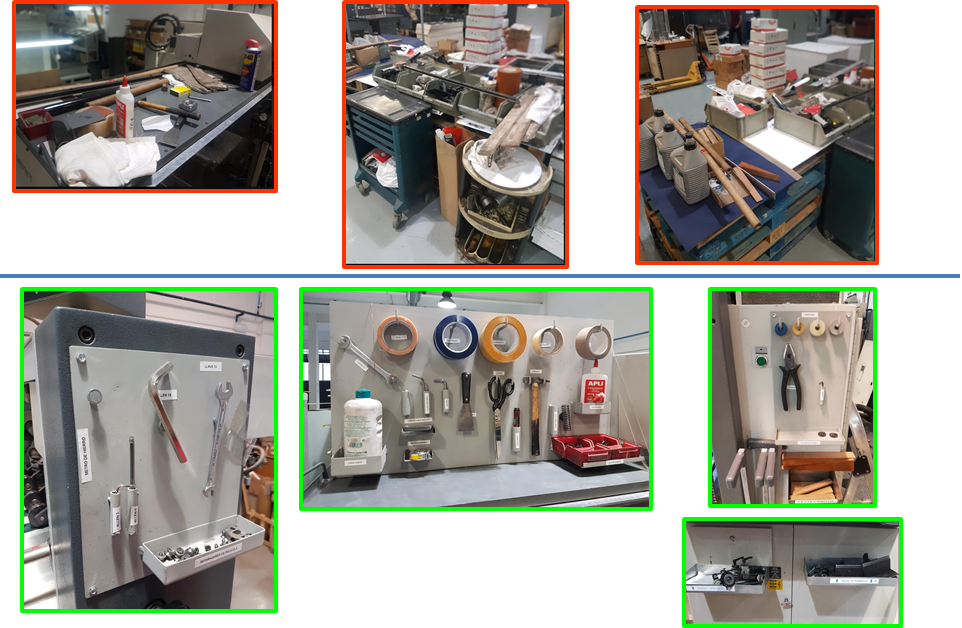
Before / After: Starting Point
5S: Order to maximize machine efficiency 801
5S: Order to maximize machine efficiency 803
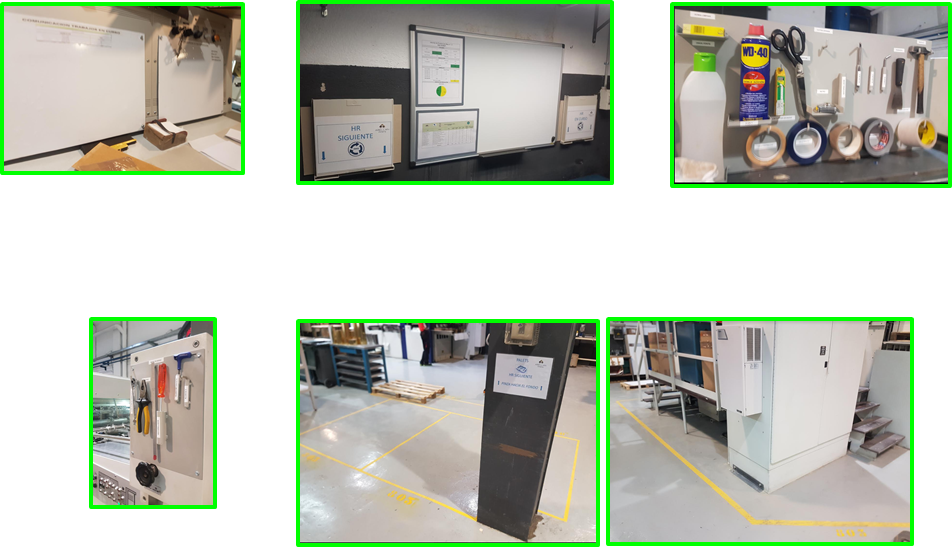
Standardization: Order and location of tools and consumables
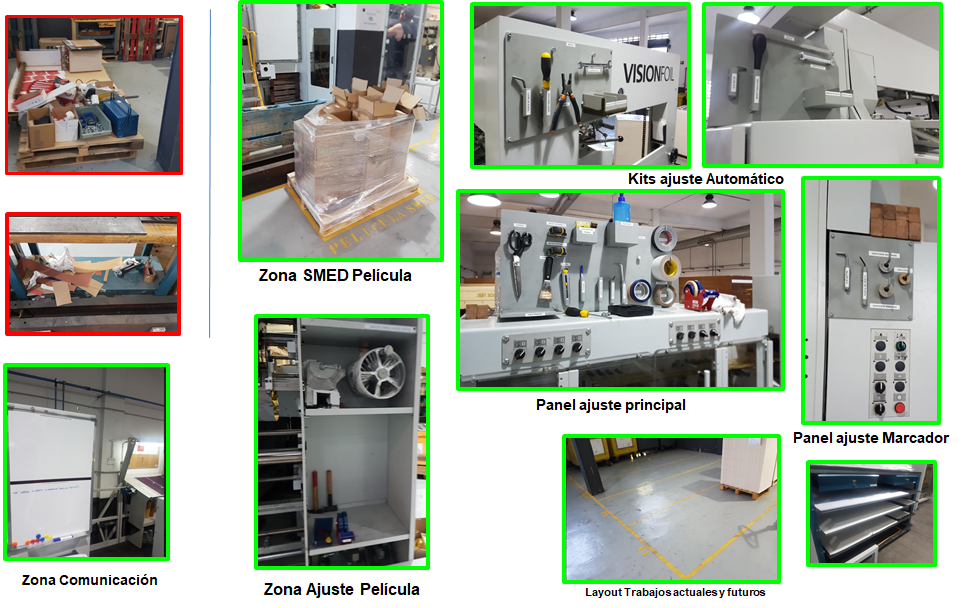
Before/After: Results
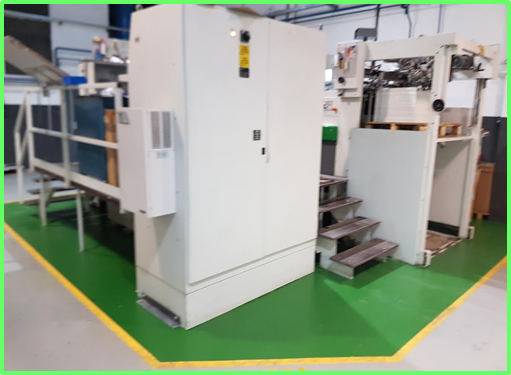
Disposal of obsolete
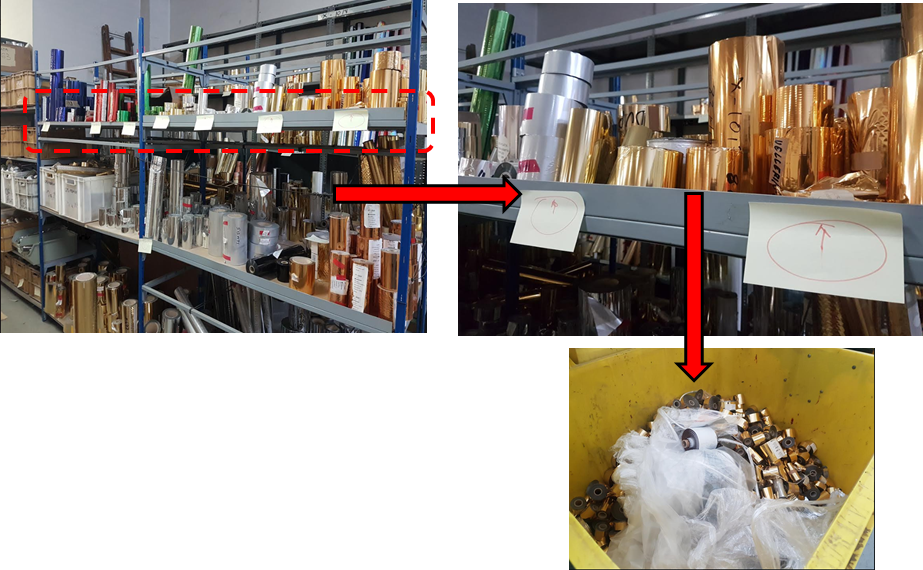
1stS in films: Removal of Obsolete References for:
- Reduce search and machine replenishment times
- Improve waste consumption and reduce film cost/m2
Warehouse adaptation and visual organization
Standardization of storage by type and size
Implementation of separators to increase storage capacity
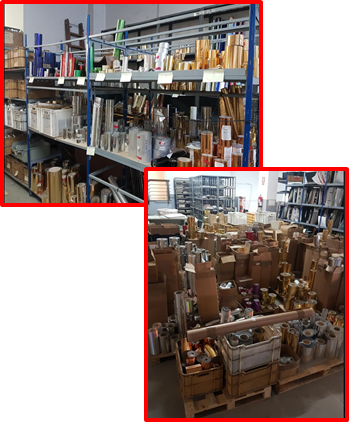
Mixed references and formats + presence of obsolete references
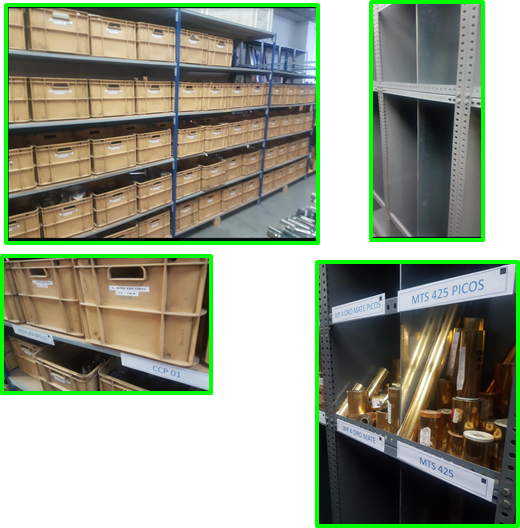
- Visual order by reference and format
- Obsolete items removed
- Increased warehouse capacity
- T search reduction
- SATISFACTION OF THE ENTIRE STAFF
Visual Management in Warehouse
Films / Samples / Photolithographs and soon engravings
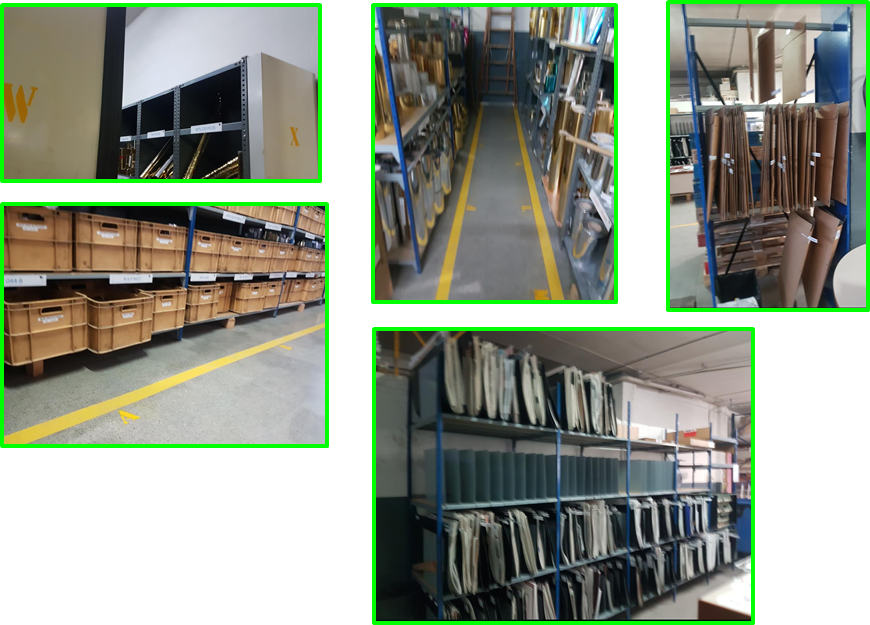
Consumables Finder Software
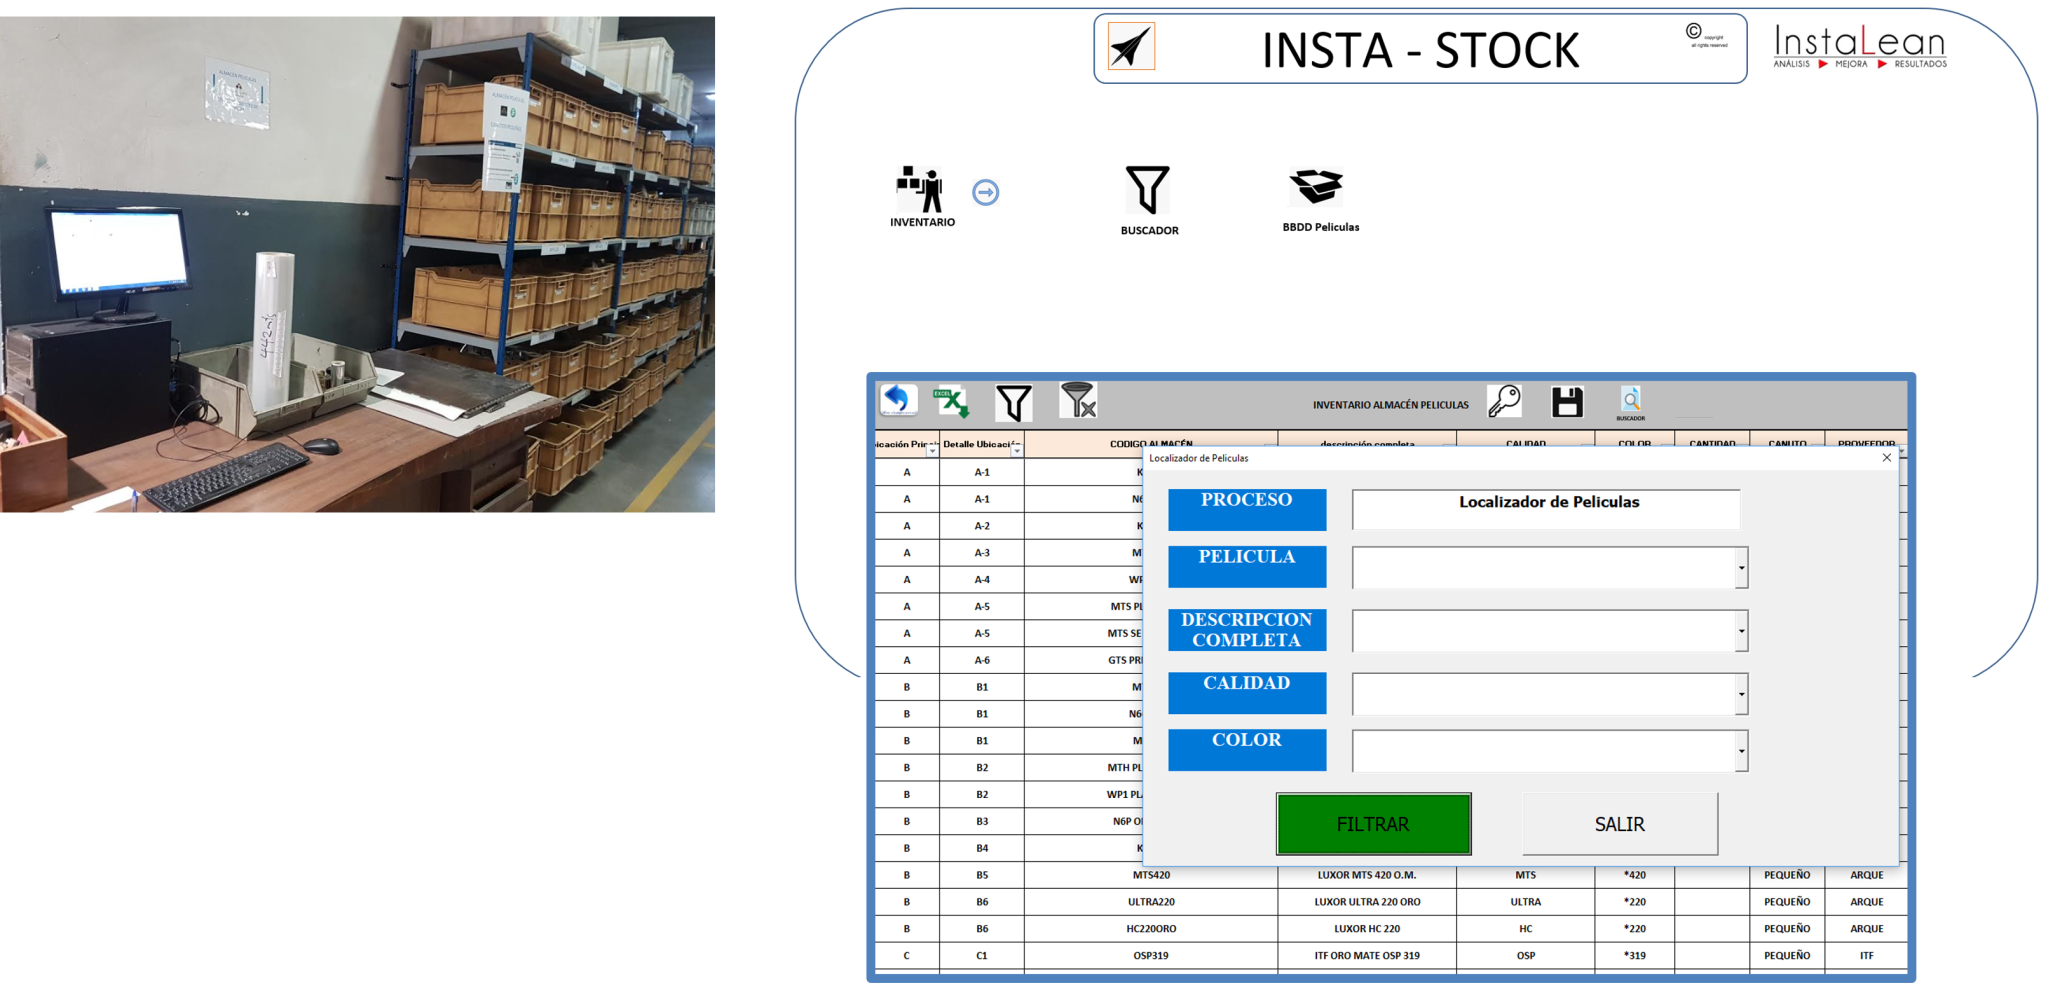
Stock Control Tool and Quick Search with Keywords
Summary of Production System Created
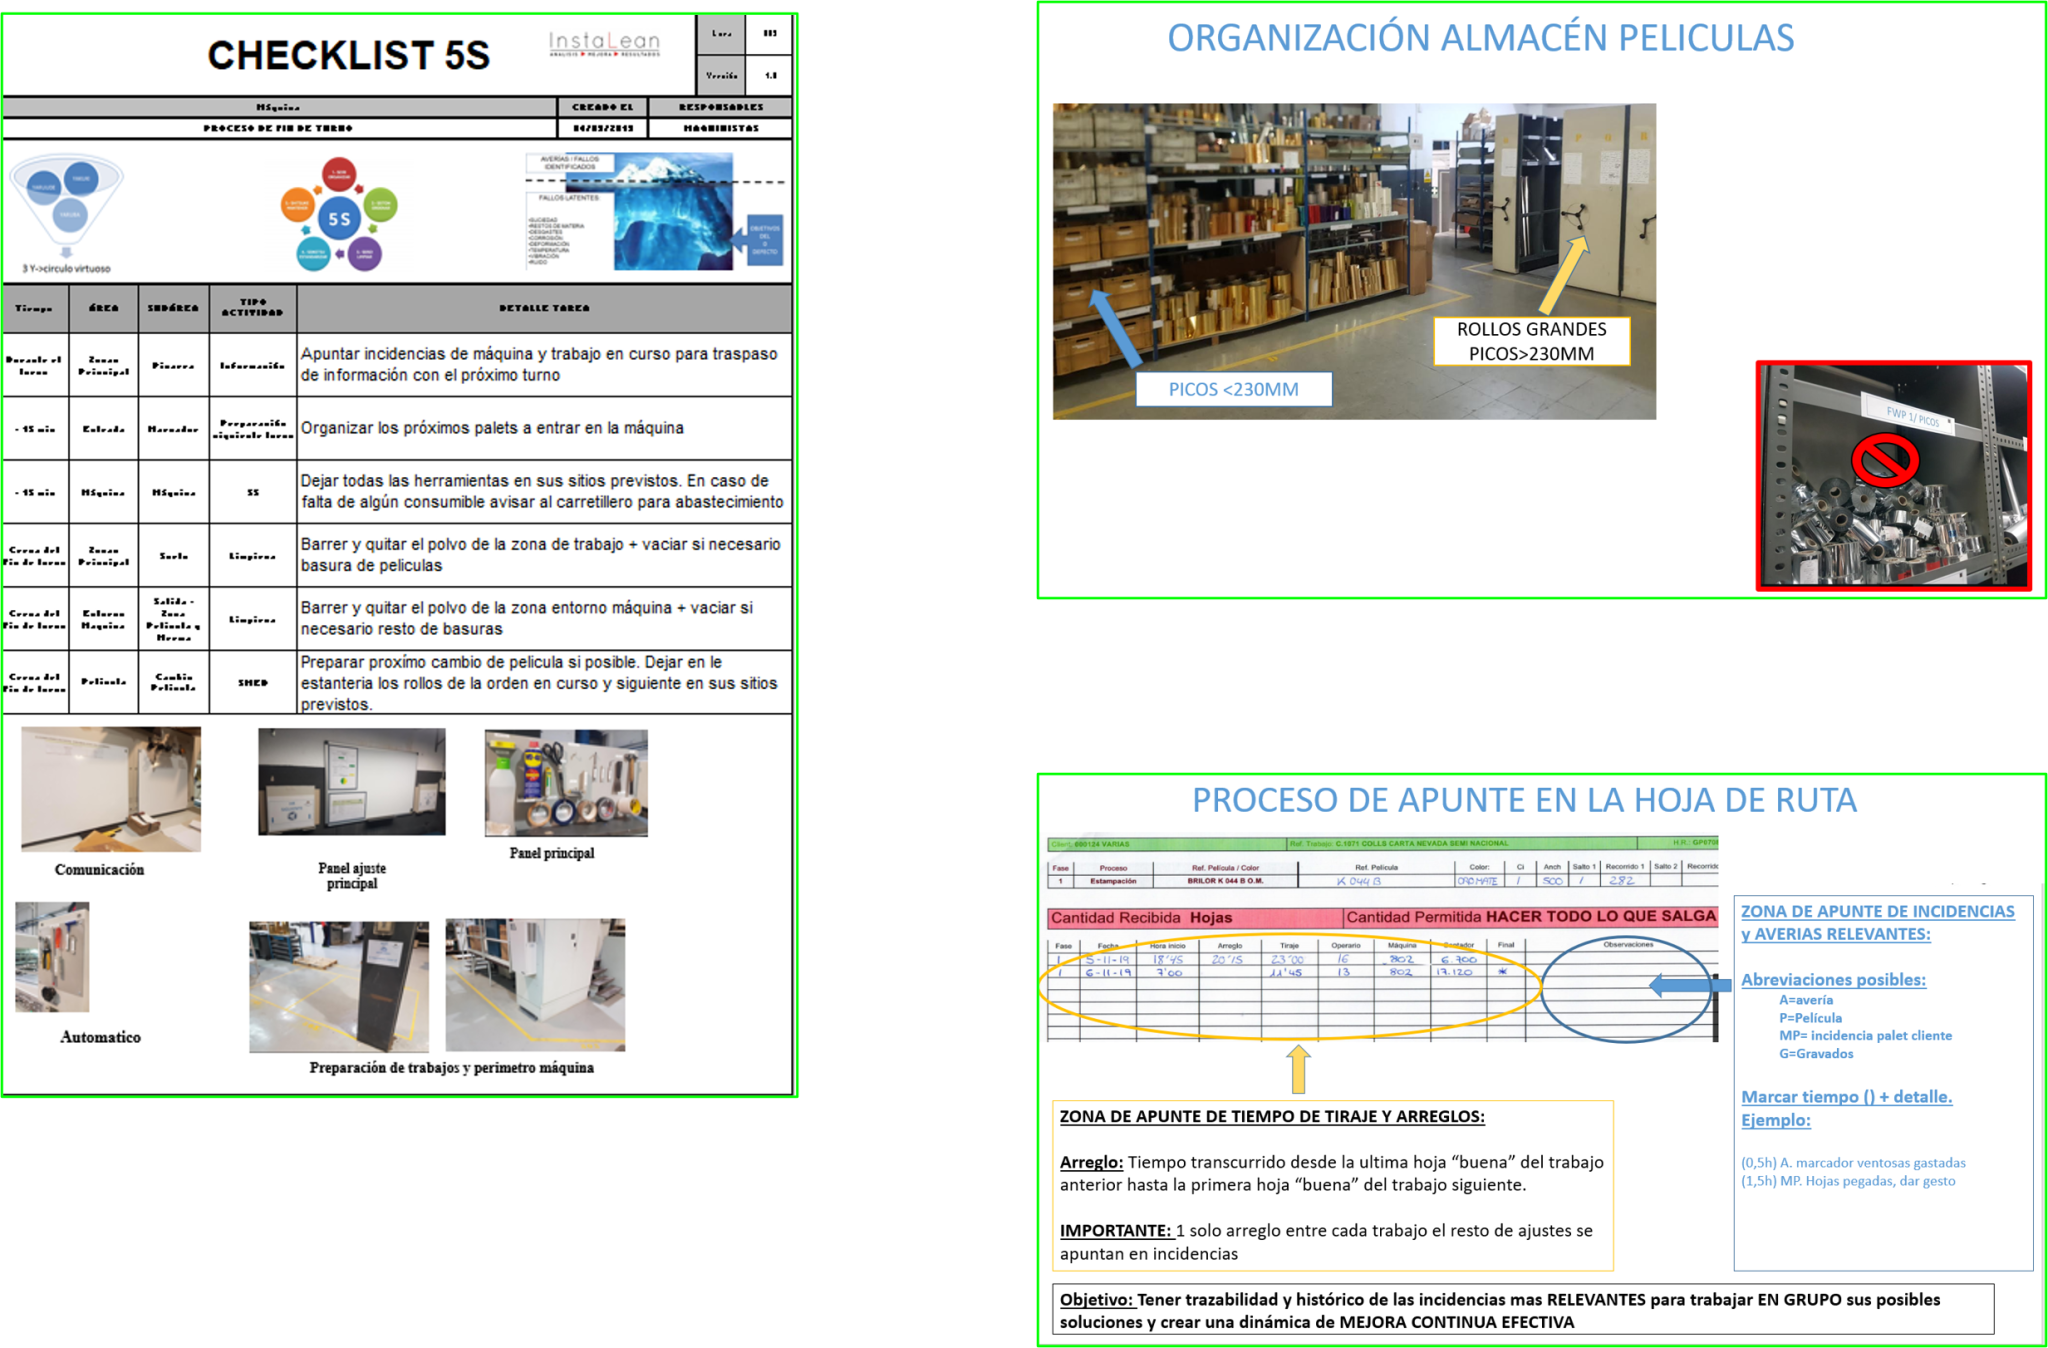
Implementation of the First Processes
Implementations January-February: Cleaning procedures
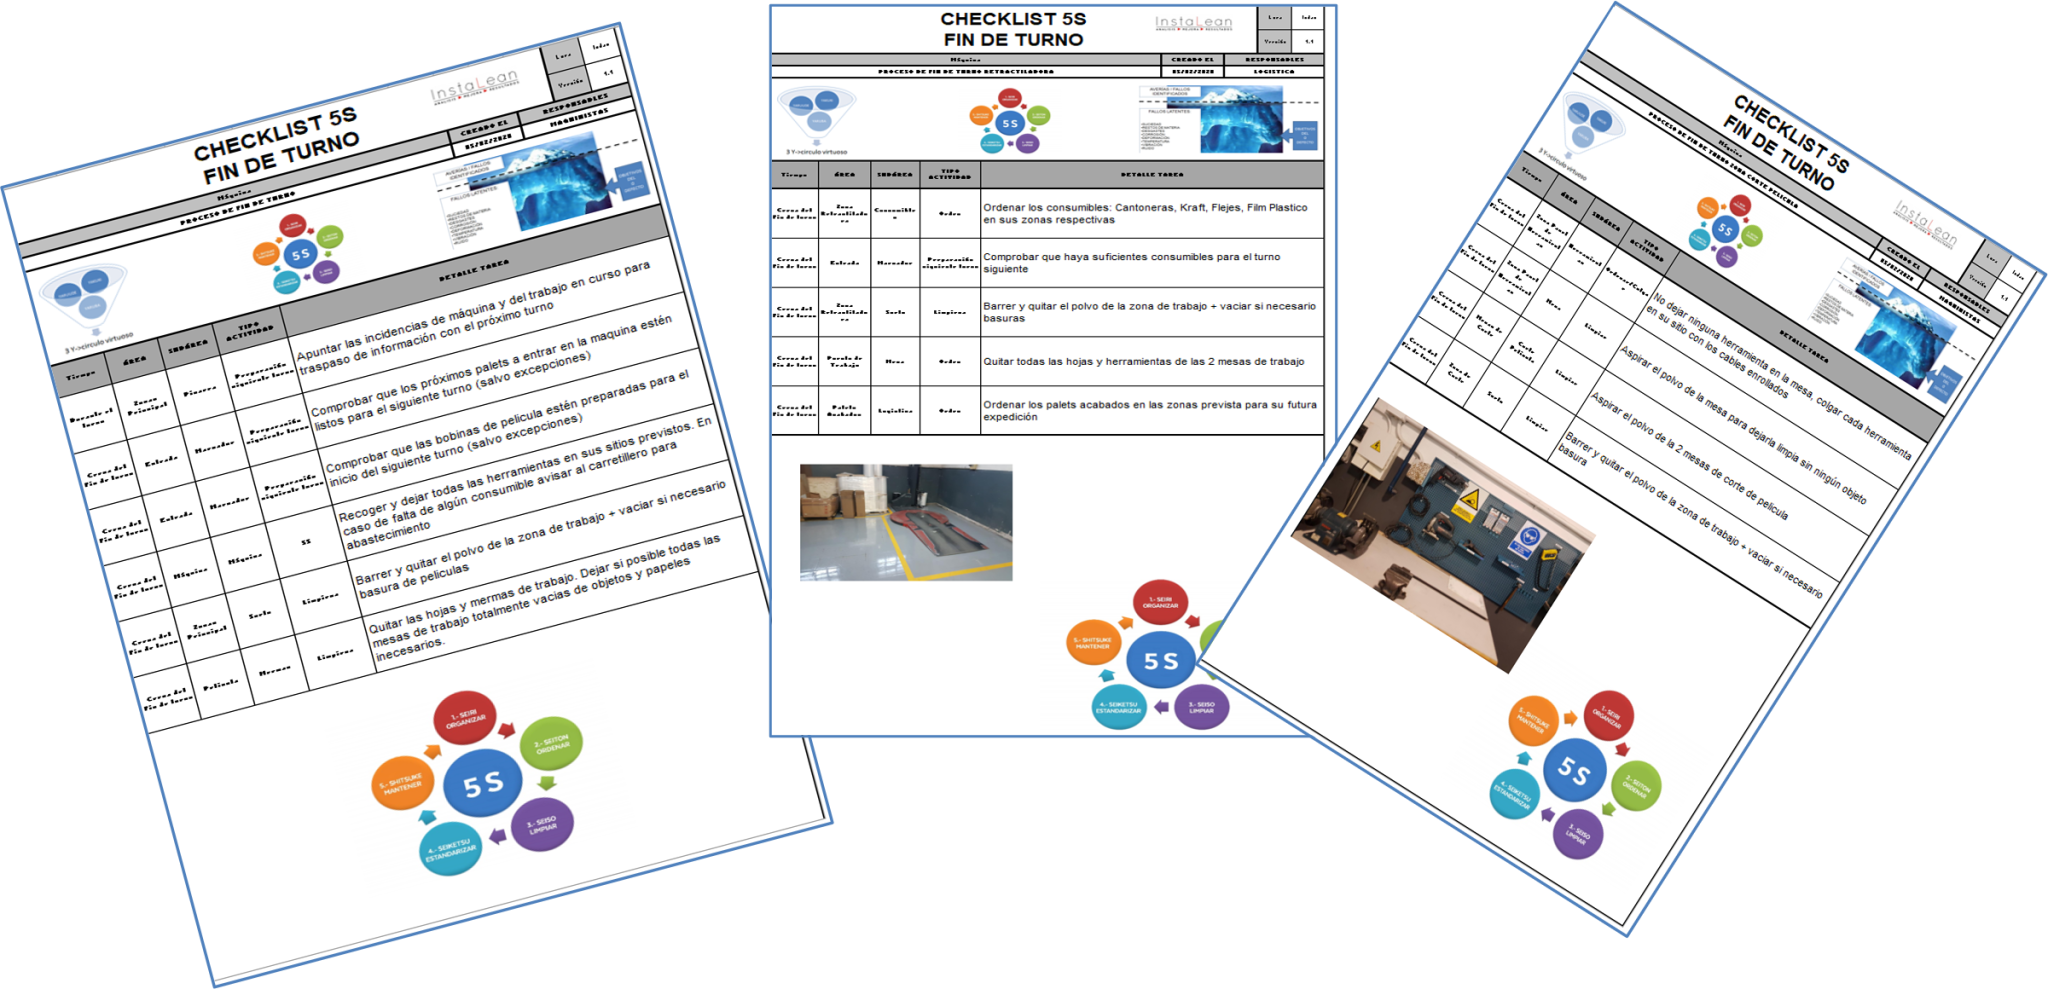
Implementation of order and cleanliness guidelines at the end of each shift
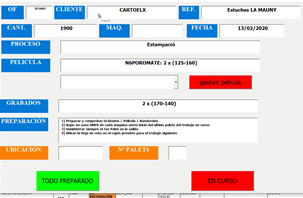
SMED checklist for preparing and supplying orders to production by internal logistics with quality check
Process Map Definition
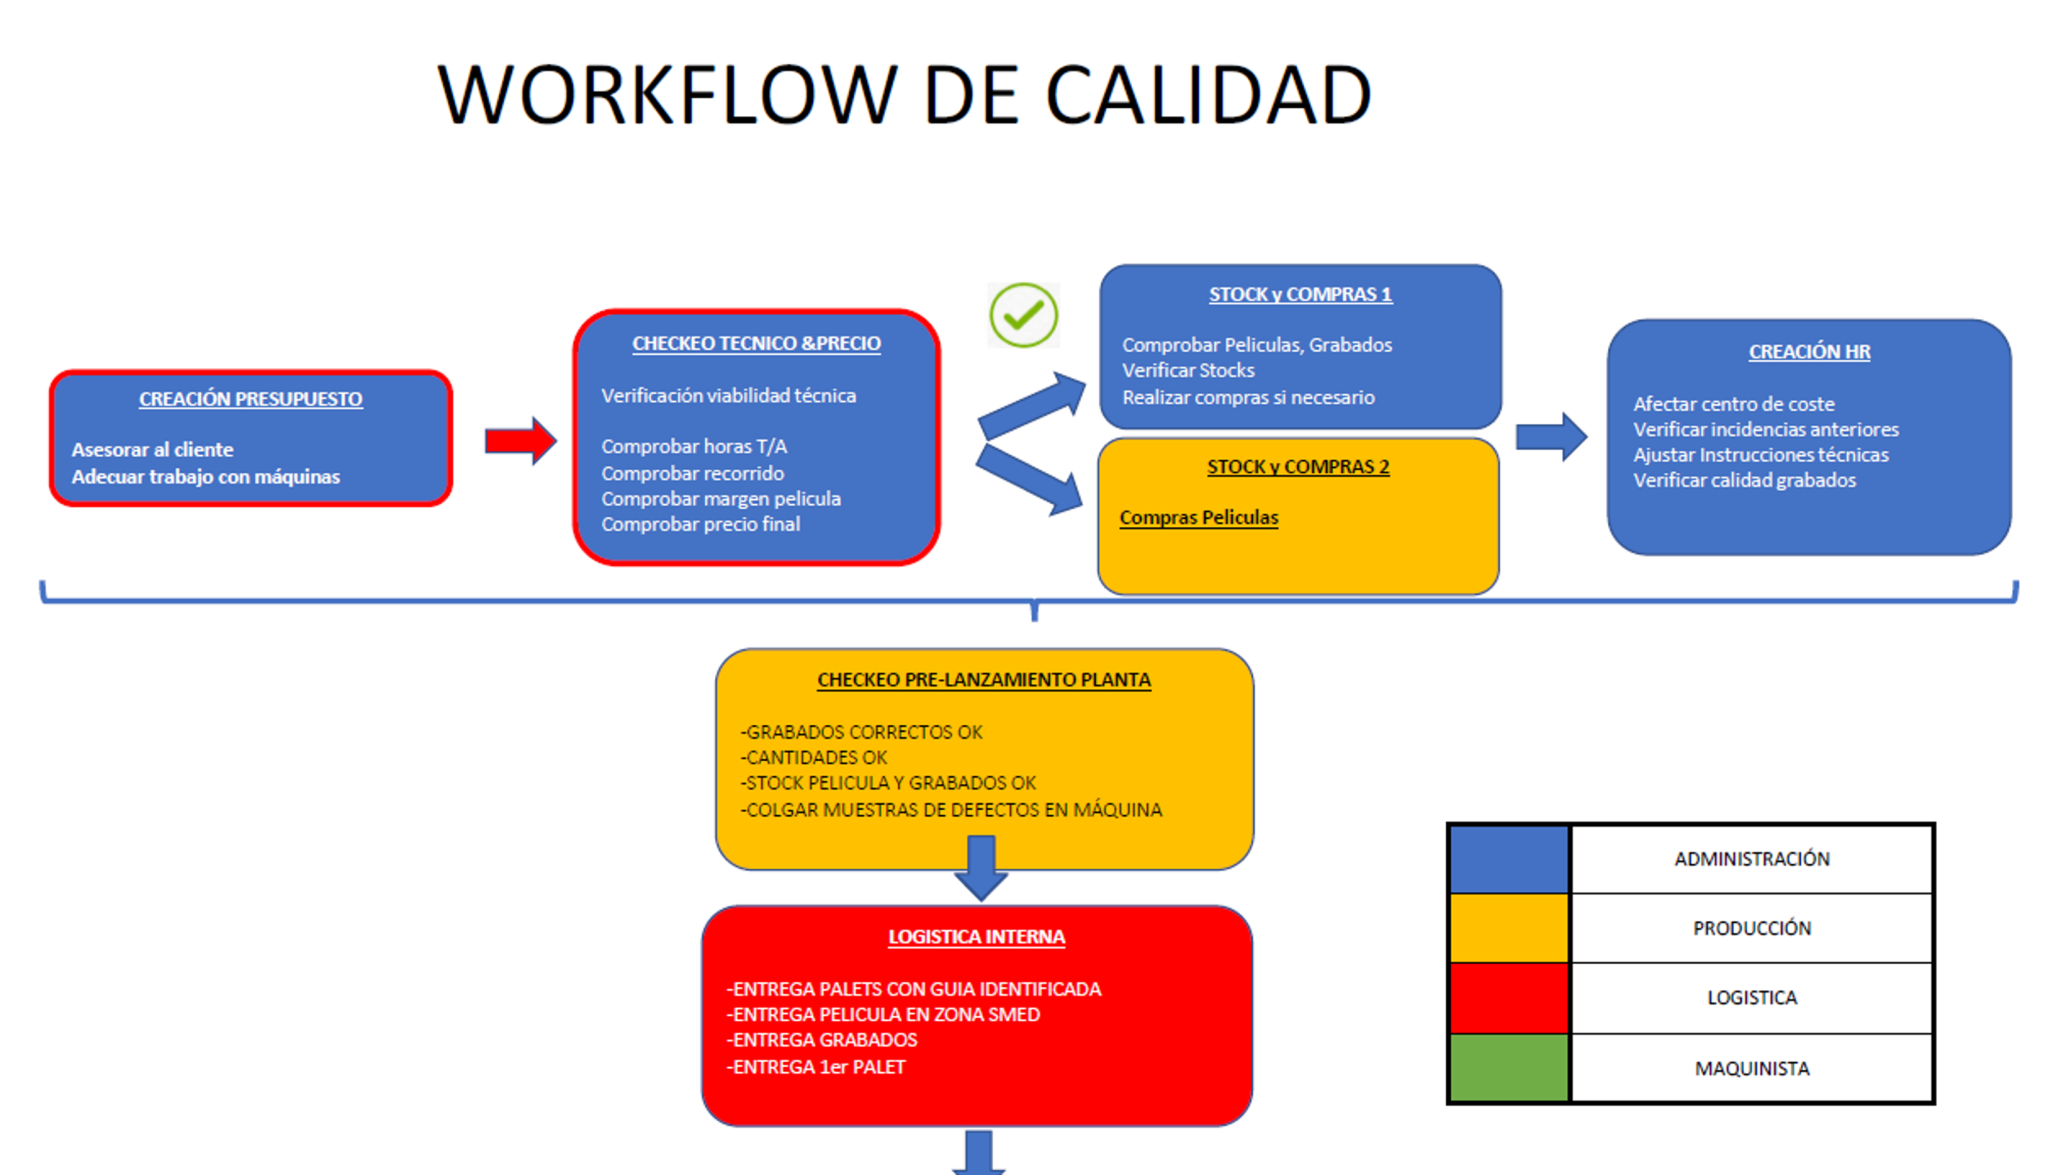
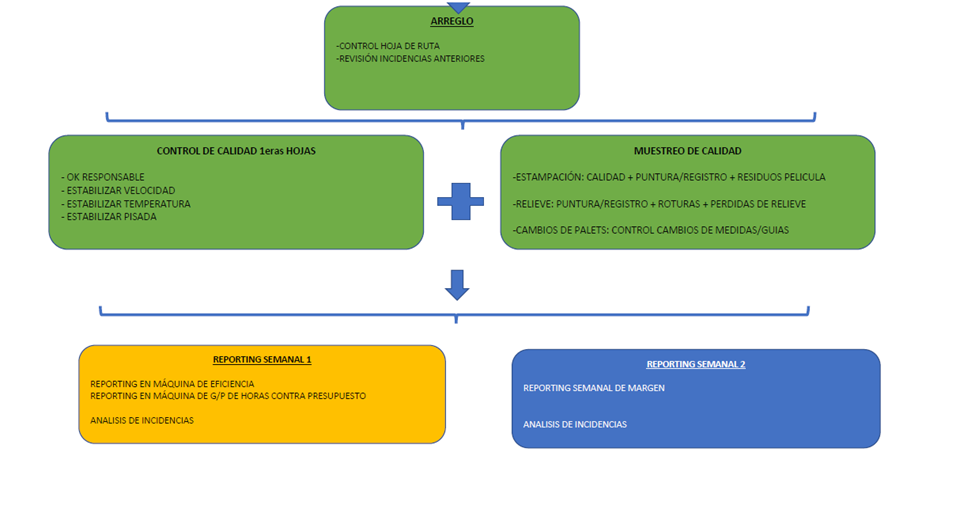
Summary of Production System Created
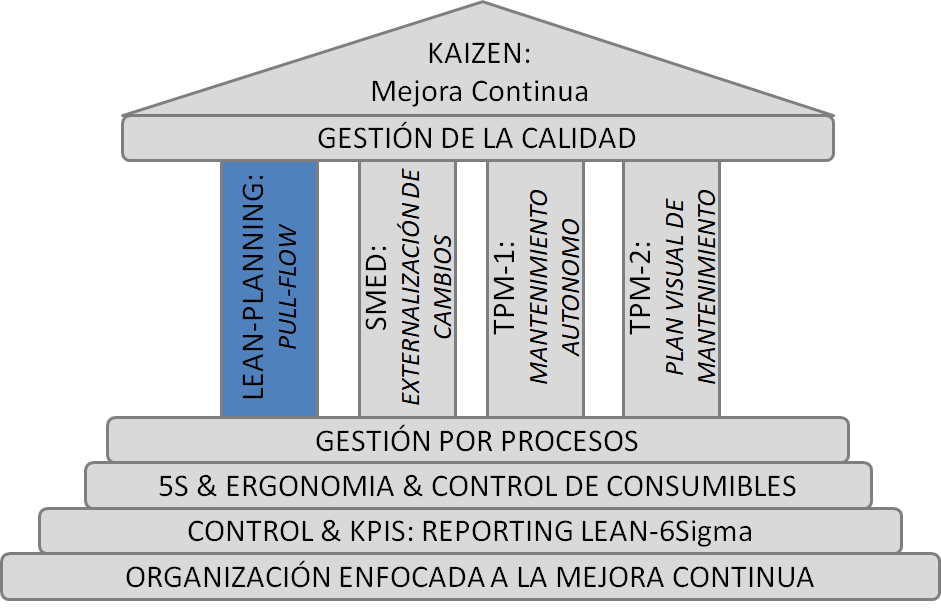
Lean Planning
Implementation of Pull flow throughout the pre-sales and pre-production chain + 4 Concorde-type “hyper-connectivity” terminals for real-time control of the status of all orders 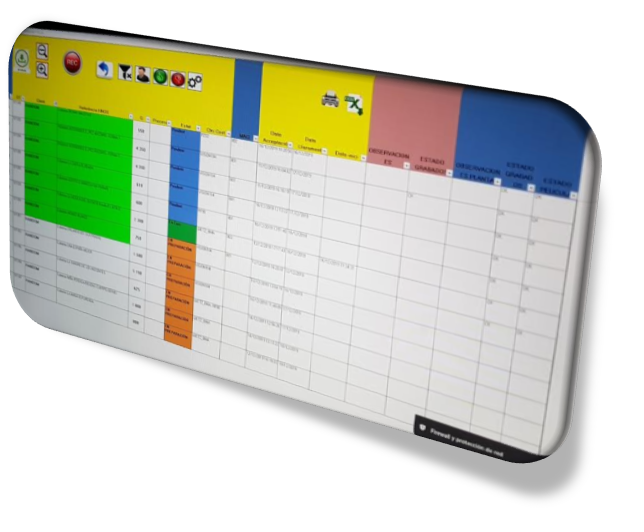
Implementations January-February: Digital planning workflow
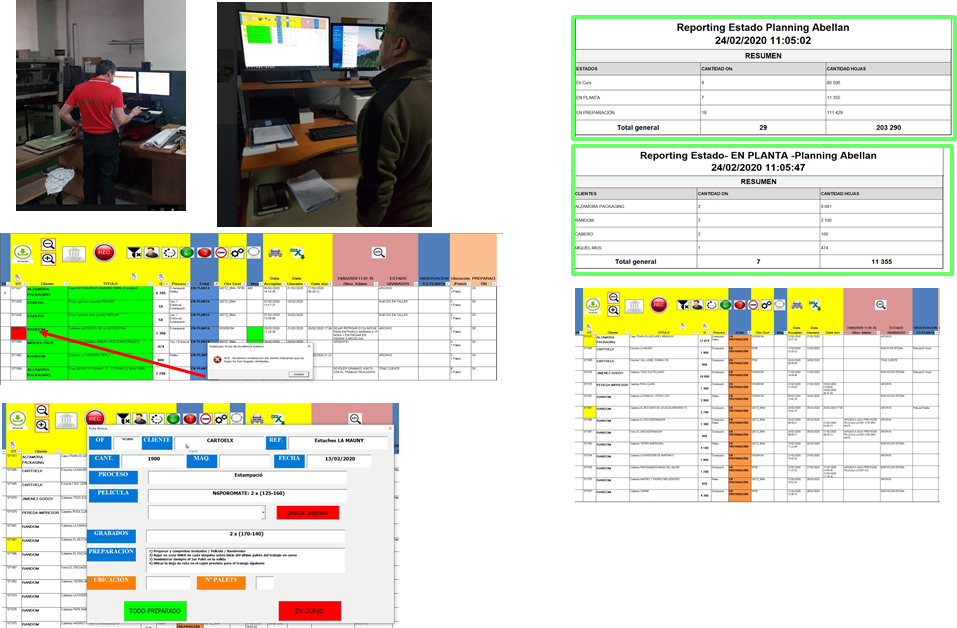
Interconnection of the departments: Technical Operations, Orders, Purchasing, Logistics and Production. Notifications of previous incidents and technical management modules for Purchasing and Logistics.
Implementations January-February: Engravings Warehouse + Logistics Warehouse 1
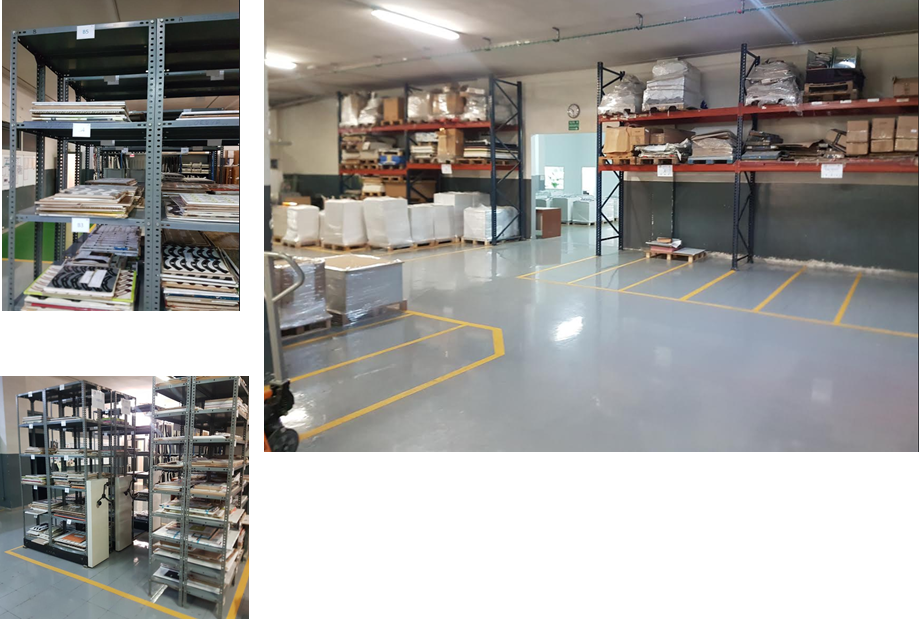
Summary of Production System Created
Quality Zone: Making Quality Visible
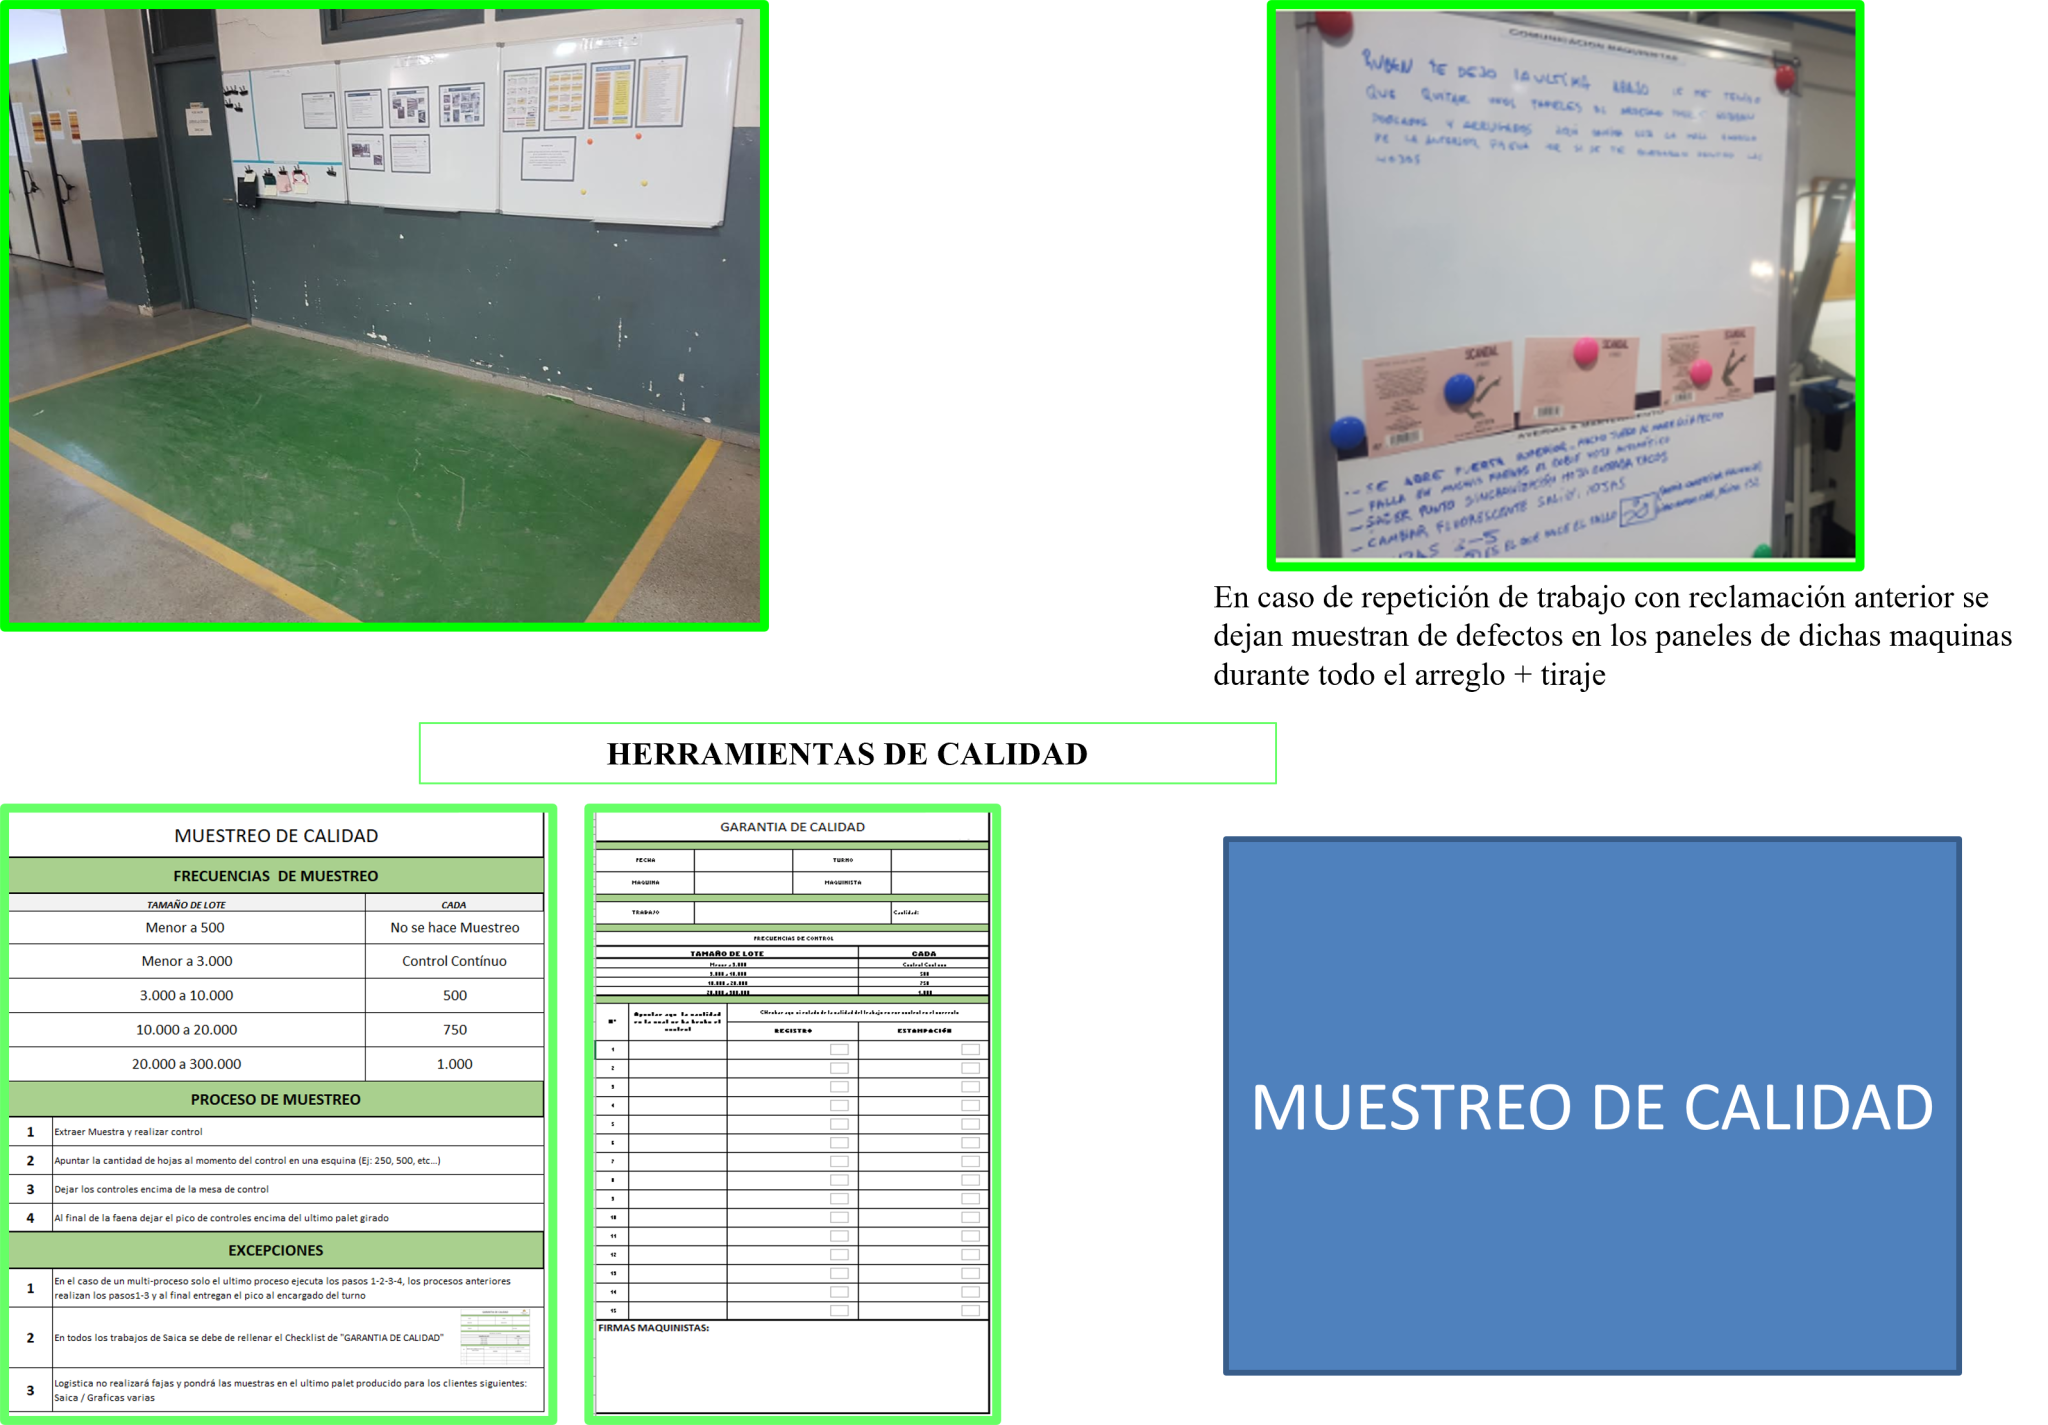
Implementation of Quality Tools
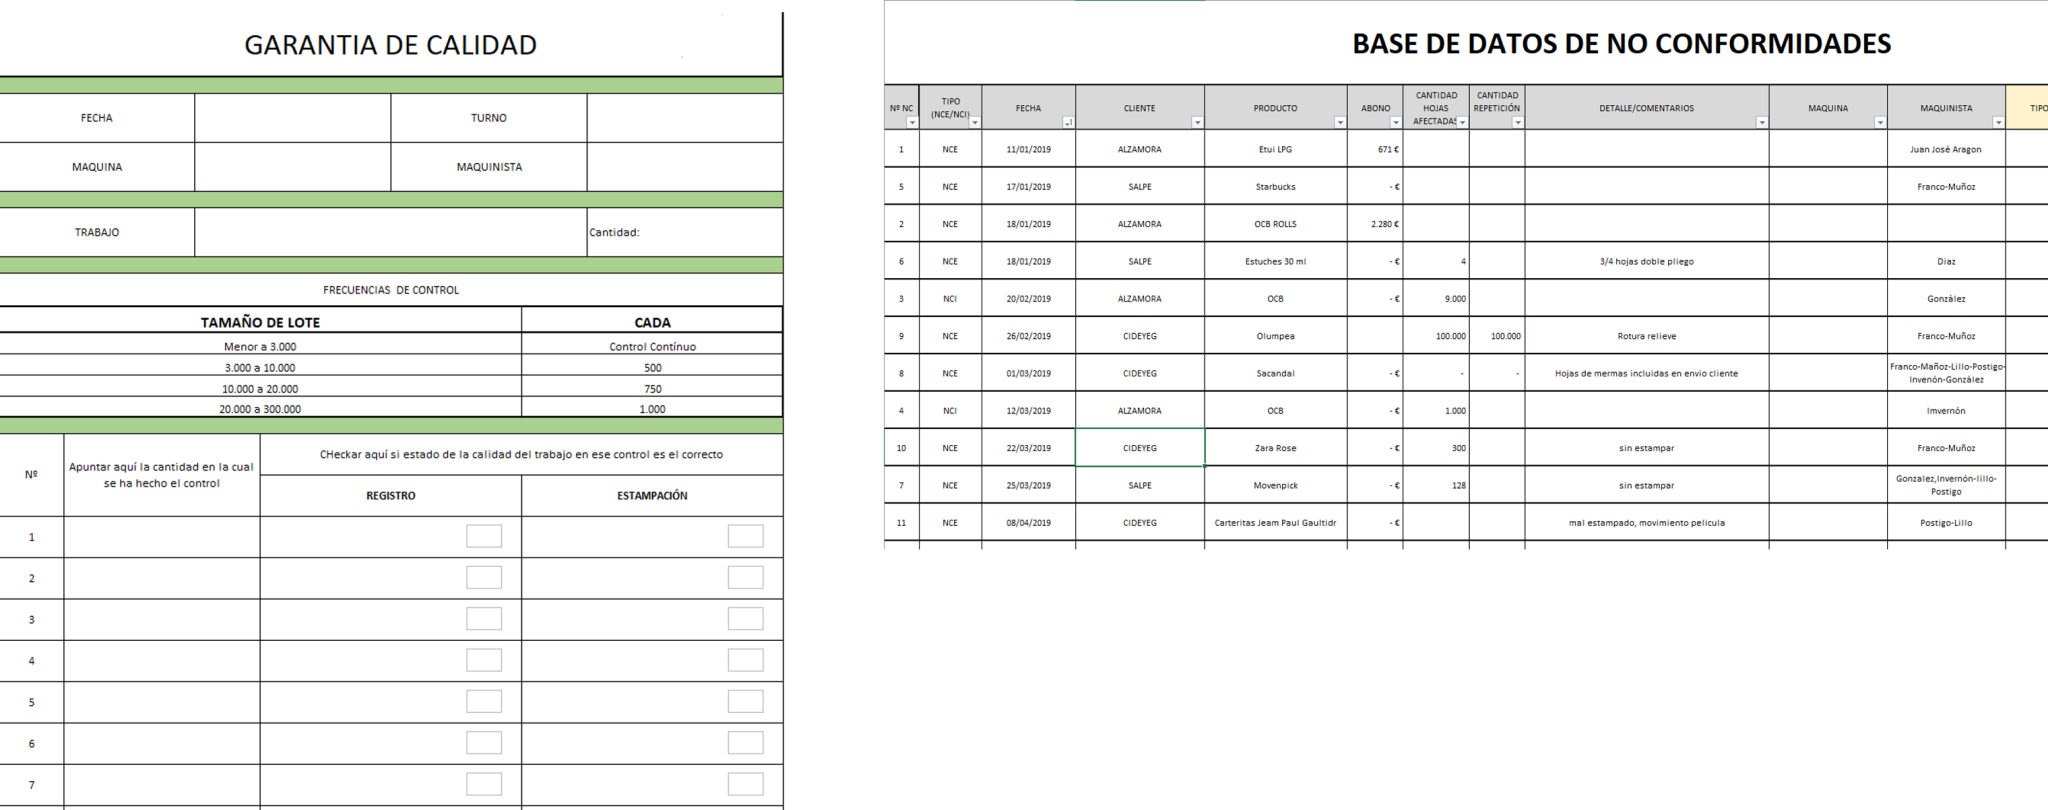
NCE control, machine control checklists and sample release
Implementations January-February: Non-Quality Management Module
Quality management tools:
- Full registration
- Control KPIs
- Communication & NC Resolution
Shift Change Optimization
A simple way to improve your company's efficiency is to do the following: choose a process that is repeated every day or even several times a day, and optimize it to reduce waste in terms of time that is not value-added to the business and inefficient production starts.
Background and objectives
Customer details:
- Company dedicated to the manufacture of household chemical products
- Performance on a semi-automatic high-production line
- Analysis of the shift change process
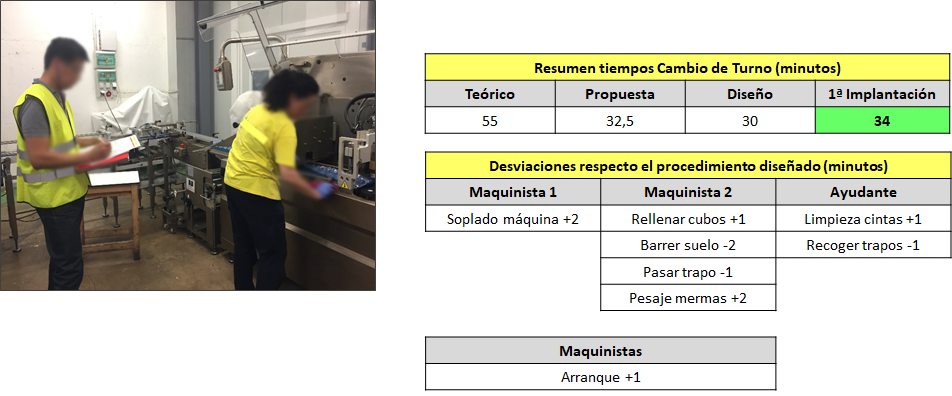
Starting point:
- 40 minutes of end-of-shift cleaning
- 15-minute startup
- A total of 55 minutes per shift
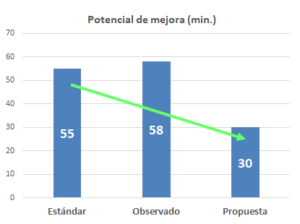
Aim:
- Reduction of time to 30 minutes, without increasing the number of people
- A gain of 50 minutes of daily production, equivalent to an efficiency increase of 5% per shift
Calendar
Scope of work:
- Analysis – Design: plant observations
- Brownpaper & brainstorming workshop
- Design of standards and procedures
- Implementation and adjustments: on-site observations
- Implementation control: monitoring results
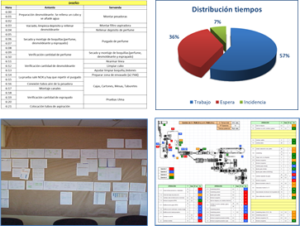
Analysis – On-site observations
Shift change observation (example):
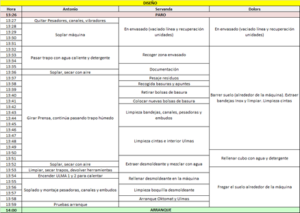
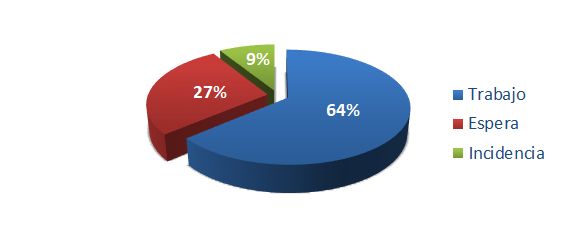
Time allocation:
Design optimal observation procedure
Brainstorming & Brownpaper
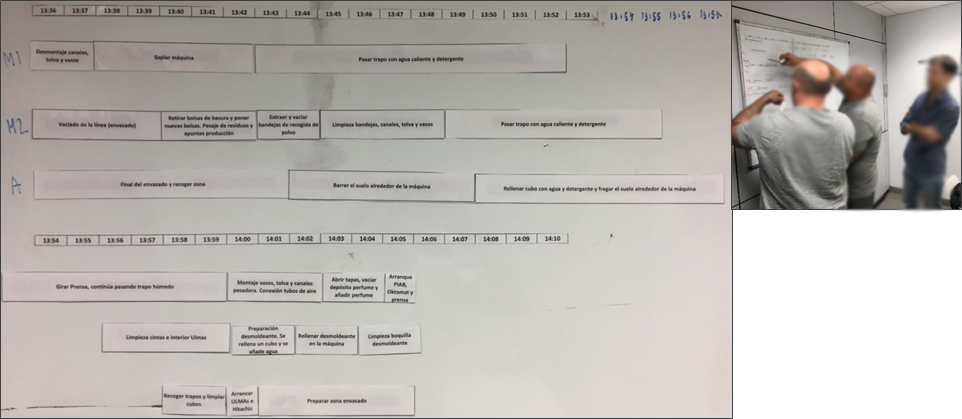
FIRST VERSION OF INSTALEAN
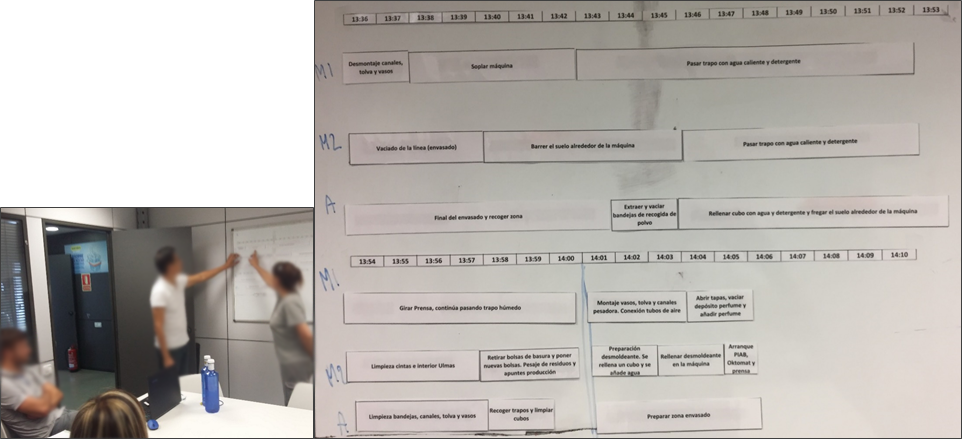
VERSION AFTER THE WORKSHOP
Procedure design

Gantt (simplified):

Requirements and suggestions for improvement:
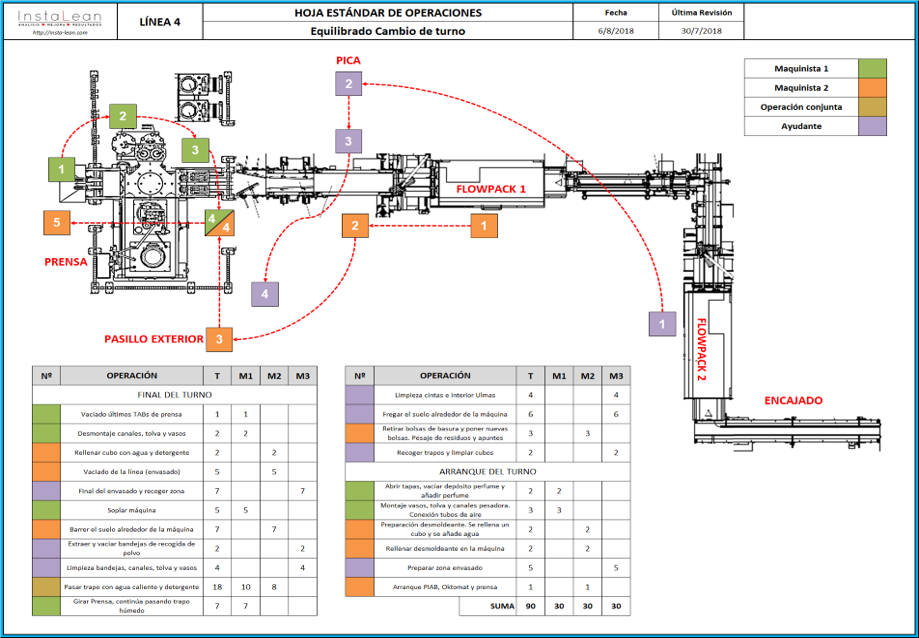
- 3 people trained to meet the defined standard
- Task allocation and operator balancing
- Outsourcing tasks with the machine running
- Definition of cleaning frequencies during the shift
- Recovery of units during the shift
- 5S solutions adapted to the shift change process
- Proposal for improving existing tools and utensils
- Control and monitoring of times
Standard operations sheet
Implementation and adjustments
Measuring implementation times:
Monitoring results
Monitoring implementation times:
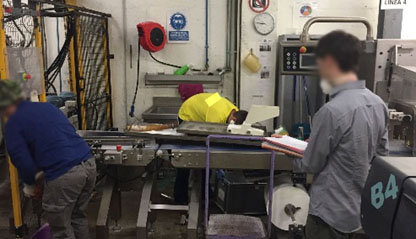

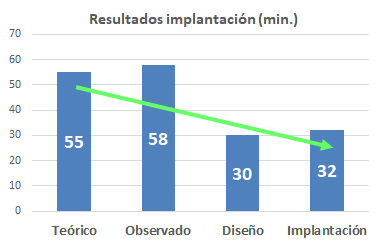
Monitoring plant times:
Self-control by the operators
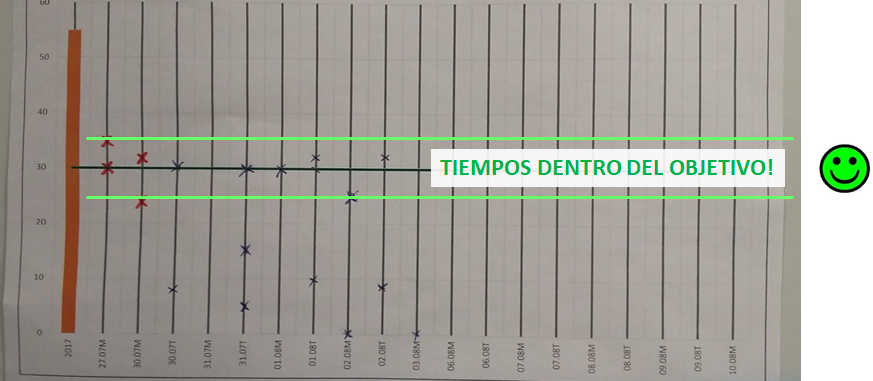
Efficiency Control line of study
Increased efficiency:
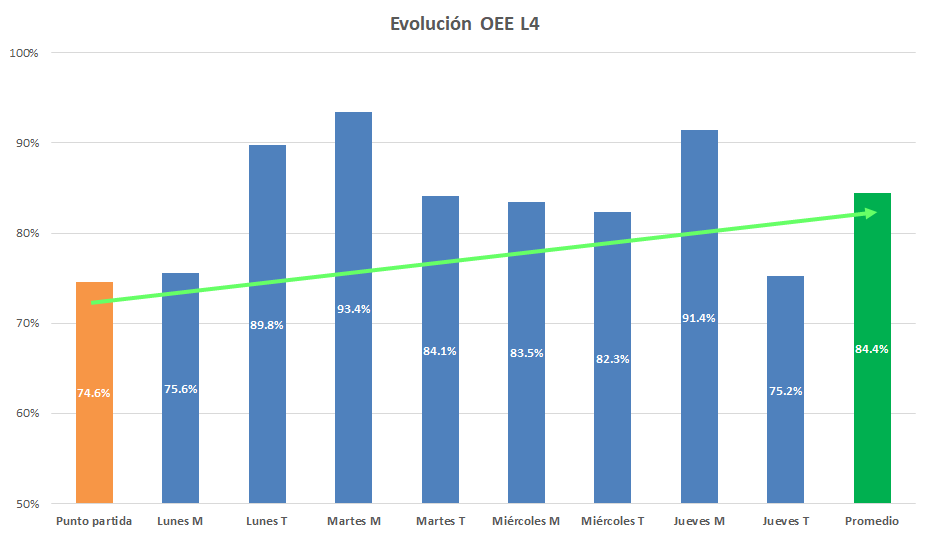
Reducing shift change time has a direct and immediate impact on line OEE:
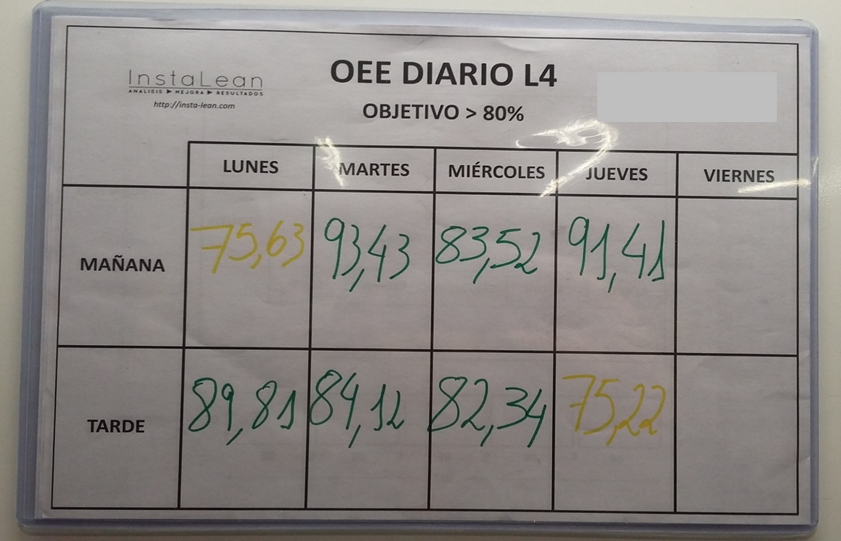
Evolution of efficiency line of study
Increased efficiency: